Operations | Monitoring | ITSM | DevOps | Cloud

%term

What is Network Topology? Definition and Overview of Types

Imagine trying to navigate a new city without a map—you wouldn’t know where to go, how to get there, or what obstacles might be in your way. As a network administrator, understanding network topology is just as vital for navigating and maintaining a stable network. Without a detailed knowledge of the pathways of your network infrastructure, troubleshooting and network management become unnecessarily complex.

AVD Performance Dashboard

In this dashboard tutorial video, we will walk you through building an Azure Virtual Desktop dashboard. This dashboard provides users with the visibility they need into the status of Azure Virtual Desktop. The Azure Virtual Desktop dashboard combines CloudReady and Service Watch metrics for a holistic view of Azure Virtual Desktops availability and performance. When issues occur, users can quickly review the dashboard to identify whether the issues is limited to an office, individual device, or affecting Azure Virtual Desktop as a whole.

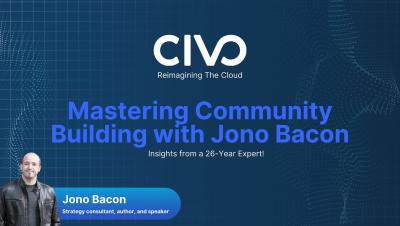
Mastering Community Building with Jono Bacon Insights from a 26 Year Expert!

Join Jono Bacon, CEO and Founder of The Community Leadership Core, as he shares his journey from the early days of open source to leading large-scale communities at companies like Canonical, XPRIZE, and GitHub. Discover key insights on building and sustaining thriving communities, the challenges of maintaining open-source projects, and the evolution of community platforms like Slack and Discord. Find out more about Jono Bacon and The Community Leadership Core.

AppDynamics APM At a glance

Observe and secure your applications across your environments to optimize business outcomes. Get a first-hand overview of how Cisco AppDynamics leads the competition with application performance monitoring that ensures business context helps make optimal decisions through prioritization of the most critical business transactions, improvements to end-user experience, and securing applications from the inside out.

Kentik Bytes - Cloud Network Performance Metrics

Phil Gervasi introduces a quick and easy way to see network performance metrics among multiple cloud instances. Synthetic tests can be deployed in multiple public clouds to test for loss, latency, and jitter among public cloud instances, such as between AWS and Azure. Phil demonstrates the ability to adjust the time range and shows inbound and outbound traffic, average latency, packet loss, and jitter. A spike in any of these metrics would trigger an alert tied to the ticketing system. He also shows the ability to click into the path view between cloud instances to see a hop-by-hop breakdown.

Kentik Bytes - Identifying Idle Cloud Resources

Phil Gervasi introduces a method for identifying idle resources in AWS using the Kentik platform. By selecting dimensions such as Logging Status, Observing VPC ID, and Observing Region, users can filter the data to determine if a resource is actually doing anything from a network perspective. “No Data” messages indicate resources with no network activity, and a more specific filter can be created based on this message to isolate idle resources. By adjusting the time frame and observing bits per second, users can determine how long resources have been idle.

What is Developer Experience (DevEx)?

We asked developers across the globe, each with their own take on what makes for a great developer experience. And while every developer’s journey is unique, the need for smooth, efficient workflows is universal. That’s why we’re excited to kick start DevExDays – a celebration of the tools, practices, and innovations that make development easier and more intuitive. To make it even better, we’re offering up to 80% off your first GitKraken Pro seat with the code DEVEXDAYS24 for a limited time!