Operations | Monitoring | ITSM | DevOps | Cloud

Dashboards

What is a single pane of glass?

There’s a new Azure agent in town – Azure Monitor Agent (AMA). I hear you saying, “Wait, aren’t there already enough Azure agents? So why another new agent?” A very valid question! Indeed, there are already a few Azure monitoring agents: the Log Analytics Agent, the Diagnostic Extension agent, and the Telegraf agent (and also the Dependency agent if you want to count it separately).

How I started contributing to the Grafana open source project

My name is Karine. I’m a Software Engineer working with a team that provides monitoring solutions to our clients. A good part of my daily work is creating dashboards in Grafana. Since I started working with this tool, I have been so impressed by the quality and ease of use. I became even more impressed when I discovered it was an open source tool.

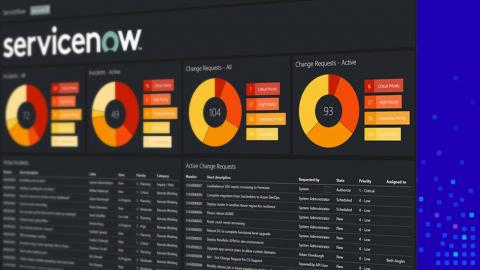
Get ServiceNow data alongside SCOM, Pingdom and more

For those on an ITIL journey, ServiceNow appears to be the service to beat. ServiceNow has tremendous flexibility and thousands of different workflows to support your business. And if you’re using SCOM to populate your CMDB, you’re leaps and bounds ahead of the average organization. Sadly, that flexibility comes with the cost of being stuck inside of the ServiceNow web interface.

Analyzing Elastic Workplace Search usage in a Kibana dashboard

Let’s start off with some good news: since 7.9.0, your Elastic Workplace Search deployment has been collecting and logging product usage data for you and your team. Usage data like, what your users are searching for, what links they're actually clicking on, and which searches are falling short. And better yet, in a future release we’ll be putting a prebuilt Workplace Search analytics dashboard at your fingertips in Kibana, one of the most powerful visualization tools available.

We built LogDNA Templates so you don't have to

With an ever growing list of infrastructure improvements, new features, and issues to debug, setting up your observability tools to keep up with best practices can fall down your list of priorities. There’s simply not enough time to set up new dashboards that can give you the visibility you need to be proactive with your infrastructure.

SquaredUp 5.0 is coming And it will be bigger and better than ever before!

As the year draws to a close, we’ve got exciting news. In the new year, we will be launching SquaredUp version 5.0! So, what exactly is in this big, bold update, you ask? Expect a gorgeous new look and feel plus major improvements to our two most popular features – Open Access and Dashboard Designer. We’re also bringing you even more visualizations for your Web API integrations, so you can display data in the best possible way in your single pane of glass. The best part?

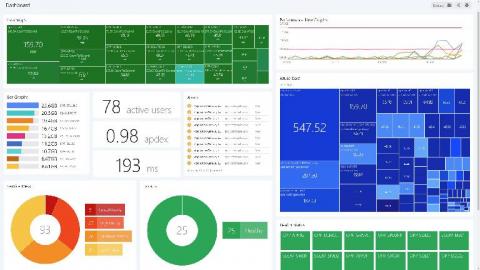
Why SCOM needs SquaredUp: Performance monitoring reporting

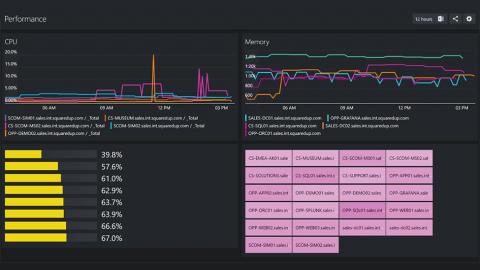
As a SCOM admin, you’re probably heavily involved with alert analysis and performance monitoring. You probably also know then, that while SCOM is a great monitoring tool, it leaves a lot to be desired when it comes to reporting on performance monitoring. I’ve got good news for you. SquaredUp sits on top of SCOM and completely changes the game. How? Why? Read on for a comparison and break down of all the reasons you should do it with SquaredUp.