Operations | Monitoring | ITSM | DevOps | Cloud

Dashboards

Layering customer, infrastructure and business perspectives into your monitoring (Part 4)

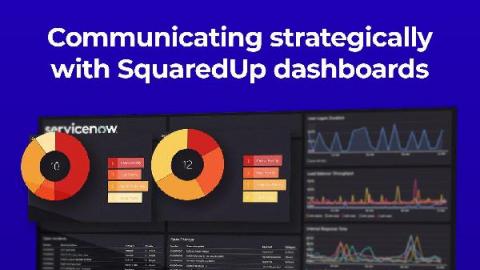
In my prior three blog posts, we set some ground rules, looked at some out-of-box dashboards, overloaded an in-box property, and finally created an innovative structure to communicate status using SquaredUp's EAM feature. Looking back, when I started this blog, I explicitly stated that traditional monitoring wasn't our goal. It's essential, but the industry (in broad terms) hasn't been successful with monitoring when the only focus is on the infrastructure perspective.

The 3 major benefits that Grafana Cloud customers get from our hosted Prometheus service

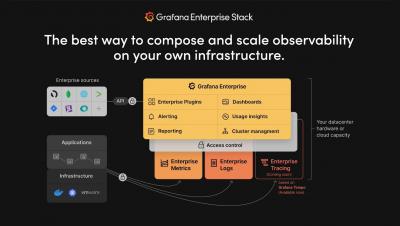
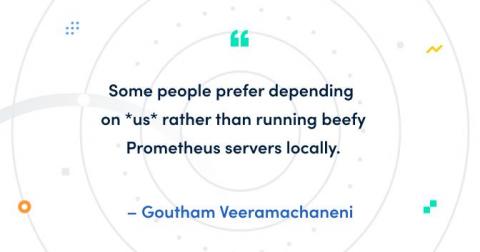
Grafana Cloud is the easiest way to get what you need for observability: Prometheus and Graphite for metrics, Loki for logs, and Tempo for tracing, all integrated within Grafana and managed by the Grafana Labs team. You can go from zero to beautiful graphs, insightful logs, and preconfigured alerts in minutes. Built with modern distributed systems techniques, Grafana Cloud allows you to grow with your applications and infrastructure and easily scale past 100M+ metrics.

Use associated template variables to refine your dashboards

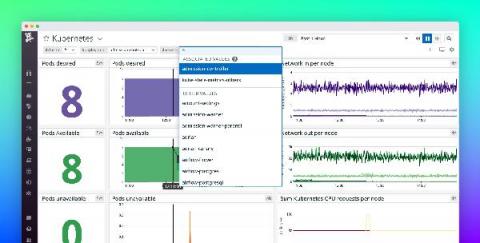
Datadog dashboards provide a foundation for monitoring and troubleshooting your infrastructure and applications, and template variables allow you to focus your dashboards on a particular subset of hosts, containers, or services based on tags or facets. We’re pleased to announce template variable associated values, which can help you speed up your troubleshooting by dynamically presenting the most relevant values for your template variables.

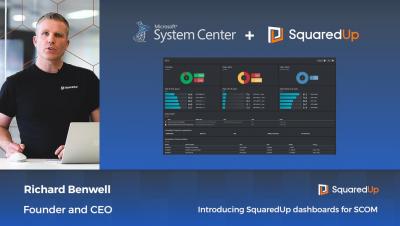
Introducing SquaredUp dashboards for SCOM

Despite its wealth of monitoring data, SCOM is often seen as a source of noisy alerting and can lack visibility of problems before they impact the business. SquaredUp transforms SCOM into one of the most visible and highly valued tools in your IT organisation. Founder and CEO, Richard Benwell, gives a quick taste of what SquaredUp for SCOM can do in your SCOM environment.

Communicating Strategically with Manual Reporting Availability (Part 3)

In my prior two blog posts, we focused on creating a bunch of Enterprise Applications (EAs), tagging those EAs, and then updating the Status dashboard to only show those EAs that are Critical Service Offerings (CSO). For this blog post, we will create some relationships and demonstrate how alerting behaves using SquaredUp's Manual Reporting Availability functionality available in the EAM tier of the product. For this post, we're going to do amazing stuff!

Creating a Day of Week Runtime Field and Using It in Kibana

The video contains a demonstration of the creation of a runtime field in which the day of the week is calculated from a timestamp field that contains the date. A visualization is then created in Kibana Lens using an indexed field and the newly created runtime field. Runtime field is the name given to the implementation of schema on read in Elasticsearch.

Instrumenting a .NET web API using OpenTelemetry, Tempo, and Grafana Cloud

OpenTelemetry is a CNCF project that standardizes observability (logs, metrics, and traces) across many languages and tools. Today we will look at how we can use the OpenTelemetry .NET library to instrument a .NET 5.0 web API, to offload traces to Tempo and logs to Loki in Grafana Cloud. Grafana Cloud now has a free plan. Set up your account and follow along!

How the new time series panel brings major performance improvements and new visualization features to Grafana 7.4

In Grafana 7.0, we introduced a new panel architecture to enhance the UX and visualization options and create a more consistent experience across Grafana. In Grafana 7.4, we expanded on that foundation and introduced the next-generation graph panel called Time series panel, which is currently in beta. The Time series panel uses the panel architecture of Grafana 7.0 and integrates with field options, overrides, and transformations.