Operations | Monitoring | ITSM | DevOps | Cloud

%term

Building a Continuous Delivery Pipeline with Git & Jenkins

This article strives to keep things as simple as possible using backwards-compatible freestyle jobs. The idea is to use the power and simplicity of Git rather than introduce complexity from - and coupling to - Jenkins. Get tips to refine the continuous delivery pipeline process with Git and Jenkins to make life easier.

Create automated chat bots with Tars, without coding

We don’t need to tell you how important it is for vendors to communicate with their customers in ever engaging ways. We also don’t need to emphasize the criticality of understanding exactly what a potential customer is looking for when visiting your product website and presenting him with a range of choices from your services. But not every business can invest in a full-blown hundred (or so) member team to handle front-desk operations for their website.

Gain deeper insight into your AWS environment with our new multi-monitor metric views

One of the biggest challenges in a self-provisioned, public cloud environment like Amazon Web Services (AWS) is finding the right balance between resources, performance, and cost. With no initial visibility into usage stats, AWS customers tend to overprovision compute, storage, and database resources to cushion sudden spikes in demand. If users could see resource usage, they'd be able to determine if the numbers provisioned are really in line with the application workload.

Independent Review: New Goliath Performance Monitor for VMware Horizon

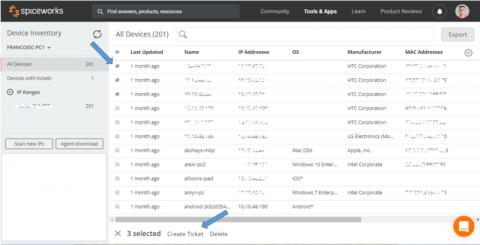
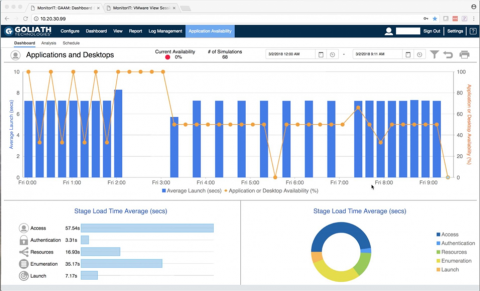
Goliath Technologies has been a strong player in the Citrix ecosystem for quite a while now with multiple products such as their Performance Monitor, Application Monitor and Netscaler Monitor. The solutions already had support for VMware vSphere to monitor virtual machines and the physical infrastructure, and since the newest version, the Goliath Performance Monitor also supports VMware Horizon.

Visualize & Create Dashboards With Grafana In GroundWork Monitor

This webinar presented by GroundWork Open Source shows users how to gather and visualize data in a clear, flexible way using Grafana dashboards in GroundWork Monitor. We'll show you how to gather data from any source, including time series data. We'll also walk through how to set your own thresholds and alerts. Presented by GroundWork Open Source founder and vice-president of product strategy, Thomas Stocking.