Operations | Monitoring | ITSM | DevOps | Cloud
%term
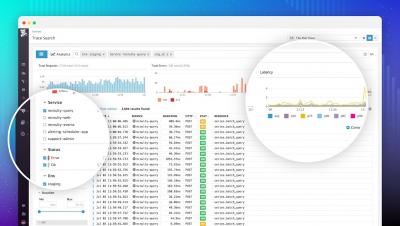
Trace Search & Analytics with infinite cardinality
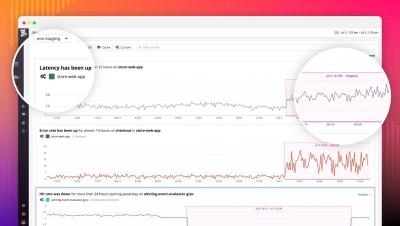
Watchdog: Detect performance anomalies automatically
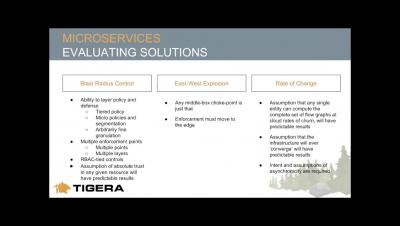
Microservices Security Summer Camp Session 3 - How to Evaluate Microservices Security Solutions
Microservices Security Summer Camp Series 2 - Best Practices for Securing Infrastructure
Microservices Security Summer Camp Session 1 - Intro to Security for Microservices
Mattermost at DevOpsCon Berlin | What is ChatOps?
Guest Blog Post: Ballerina Makeover with Grafana
In this guest blog post from the folks at Ballerina, Anjana shows you how you can easily visualize metrics from a Ballerina service with Grafana, walking you step by step through the installation and configuration of the components. They’ve also extended an offer for a free ticket to their upcoming Ballerinacon to the Grafana community.
Zipkin vs Jaeger: Getting Started With Tracing
Request tracing is the ultimate insight tool. Request tracing tracks operations inside and across different systems. Practically speaking, this allows engineers to see the how long an operation took in a web server, database, application code, or entirely different systems, all presented along a timeline. Request tracing is especially valuable in distributed systems where a single transaction (such as “create an account”) spans multiple systems.


