Operations | Monitoring | ITSM | DevOps | Cloud

Datadog

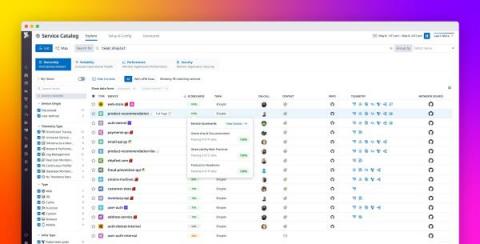
Prioritize and promote service observability best practices with Service Scorecards

The Datadog Service Catalog consolidates knowledge of your organization’s services and shows you information about their performance, reliability, and ownership in a central location. The Service Catalog now includes Service Scorecards, which inform service owners, SREs, and other stakeholders throughout your organization of any gaps in observability or deviations from reliability best practices.

Stream your Google Cloud logs to Datadog with Dataflow

IT environments can produce billions of log events each day from a variety of hosts and applications. Collecting this data can be costly, often resulting in increased network overhead from processing inefficiencies and inconsistent ingestion during major system events. Google Cloud Dataflow is a serverless, fully managed framework that enables you to automate and autoscale data processing.

Optimize your infrastructure with CloudNatix and Datadog

CloudNatix is an infrastructure monitoring and optimization platform for VMs, containers, and other cloud resources. Customers can use CloudNatix’s Autopilot feature to automatically configure and run infrastructure optimization workflows that allocate and run their resources more efficiently. CloudNatix can take action to auto-size Kubernetes and VM workloads, defragment Kubernetes clusters, and create harvest pods from unused VMs, among other key optimizations.

Understanding Request Latency with Profiling

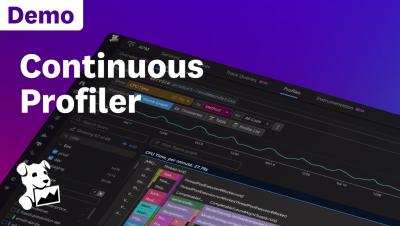
It can be hard to figure out why response times are high in Java applications. In my experience, when engineers investigate this type of issue, they typically use one of two methods: They either apply a process of elimination to find a recent commit that might have caused the problem, or they use profiles of the system to look for the cause of value changes in relevant metrics.

Datadog on Kubernetes Node Management

Datadog, the observability platform used by thousands of companies, runs on dozens of self-managed Kubernetes clusters in a multi-cloud environment, adding up to tens of thousands of nodes, or hundreds of thousands of pods. This infrastructure is used by a wide variety of engineering teams at Datadog, with different feature and capacity needs.

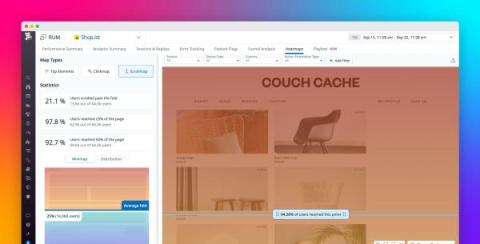
Visualize user interactions with your pages by using Scroll Maps in Datadog Heatmaps

When developing modern applications, product managers, designers, and website developers need to understand how users interact with web pages in order to guide those users through their desired journeys. For example, teams need to know if users ever see the content near the bottom of the page, where to place CTAs to ensure they are in high-traffic areas, and how to compare different pages based on user engagement.

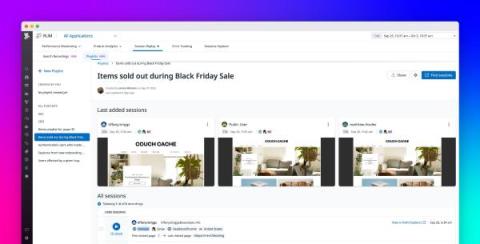
Organize and analyze related session replays with Playlists in Datadog RUM

Datadog Session Replay in Real User Monitoring (RUM) enables customers to capture and visually replay the web and mobile experience of their end users. With Session Replay, customers can quickly find and address UX errors by seeing precisely what actions an end user took, the point where they got stuck, and the outcome encountered as a result. Session Replay allows for easier troubleshooting and debugging because it delivers visible, insightful context into frontend errors.

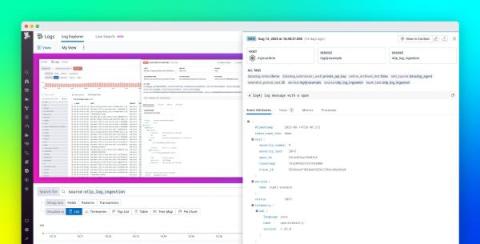
Ingest OpenTelemetry logs with the Datadog Agent

OpenTelemetry (OTel) is an open-source, vendor-neutral observability solution that provides a suite of components—including APIs, SDKs, and a data collector—that enable teams to collect and communicate telemetry data from cloud-native applications and services. OTel also defines the OpenTelemetry Protocol (OTLP), a standard for the encoding and transfer of telemetry data.