Operations | Monitoring | ITSM | DevOps | Cloud

%term

eG Innovations Introduces Monitoring Capabilities for Microsoft Office 365 at Microsoft Ignite 2018

Iselin, NJ – September 25, 2018 – eG Innovations, a leading provider of IT performance monitoring and digital intelligence solutions, announced today that it has expanded its monitoring portfolio to deliver performance visibility of Microsoft Office 365. The new capabilities will help organizations get in-depth insights into Office 365 access, usage, connectivity and performance, and enhance end user experience and business productivity.

PagerDuty Drives Digital Operations for Atlassian Users

IT Operations, DevOps, and Developer teams count on PagerDuty’s 300+ integrations to power their end-to-end real-time digital operations, no matter which tool stack they use. Because PagerDuty’s customers span all sizes, industries, and digital maturity levels, our product team is constantly talking to customers about which tools they use for needs like communications, APM, and IT Service Management (ITSM).

You've been thinking of Serverless all wrong!

While working for Dashbird.io I’ve had to pleasure to come in contact with a number of serverless early adopters that included both small companies working on apps or just testing ideas as well as fortune 500 companies with an already established user base. What I’ve found is that a lot the people I speak to think of serverless as a shortcut to developing software but that’s just not the case.

How to Monitor Azure Services with Sumo Logic

This week at the Microsoft Ignite, we unveiled two new Sumo Logic applications for Microsoft Azure services — Azure SQL Database and Azure Active Directory — and two new native integrations with Azure Monitor and Blob Storage. As a cloud-native company, our goal at Sumo Logic is to give our customers the flexibility to create digital IT and DevOps initiatives that leverage multi-cloud deployments in Amazon Web Services (AWS), Google Cloud Platform (GCP) and Microsoft Azure.

Zapier Set Ups - Pulling Downtime Alerts into Zendesk

We currently integrate with a wide range of notification systems and applications to which we can send through our Up or Down alerts based on the health and status of your website on StatusCake. Sometimes though, it’s great to have these alerts coming through to a system that’s not classically used for notifications. Today we’ll take a look at how you can have your downtime alerts sent to the Zendesk Customer Service Software & Support Ticket System.

Container Monitoring Overview with Sysdig Monitor

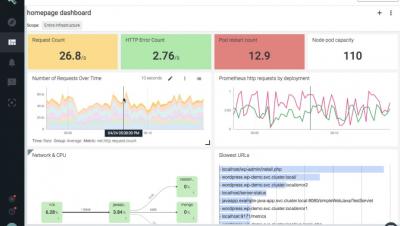
Watch this overview of Sysdig Monitor for an in depth look at how to monitor Docker containers, Prometheus metrics and more. Sysdig ContainerVision sees inside containers from the outside and ServiceVision enriches container metrics with service-oriented metadata from Kubernetes, OpenShift, Docker Swarm, and Mesos - DC/OS.

USE, RED and real world PgBouncer monitoring

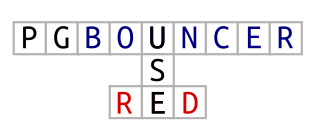
Brendan Gregg’s USE (Utilization, Saturation, Errors) method for monitoring is quite known. There are even some monitoring dashboard templates shared on the Internet. There’s also Tom Wilkie’s RED (Rate, Errors, Durations) method, which is suggested to be better suited to monitor microservices than USE. We, at okmeter.io, recently updated our PgBouncer monitoring plugin and while doing that we’ve tried to comb everything and we used USE and RED as frameworks to do so.