Operations | Monitoring | ITSM | DevOps | Cloud

%term

Best Practices for Choosing a Status Page Provider

Downtime is inevitable but what sets successful businesses apart is how they handle it. A key part of incident management is incident communication with both internal and external stakeholders. A status page is a crucial tool for maintaining clear communication with users during outages or service interruptions. There are numerous status page providers available with different features. This article will guide you through best practices for selecting a provider that suits your needs.

Pen Testing Tools: What They Are And How to Choose the Best One

Cybersecurity threats continue to grow more sophisticated, making penetration testing an essential part of any organization’s security strategy. Penetration testing tools, or "pen testing" tools, help identify and exploit vulnerabilities in your systems, networks, and applications. They are a proactive way to address weaknesses before malicious actors can take advantage. However, selecting the right one can be overwhelming with so many available tools.

How to get started with a local kubernetes development environment

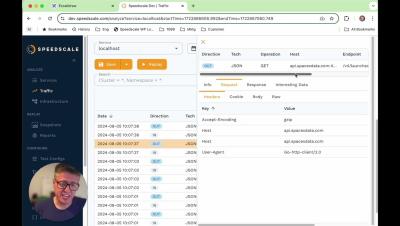
Mocks can be useful, but hard to build. You can use them as backends for development, or even tests (like load and performance testing). Speedscale takes the legwork out of building mocks, by modeling them after real observed traffic. This video covers a real-world example of how to use mocks to backend a JMeter load test.

How to Load and Performance Test Kubernetes, what is Kubernetes and nuances of the platform

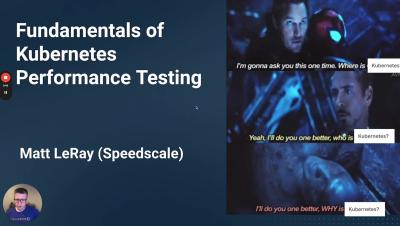
Check out Matt LeRay's talk on How to Test in Kubernetes at Star WEST 2024. Distributed architectures like Kubernetes present unique performance challenges. Autoscaling, Load Balancing and other mechanisms help with resiliency but can also serve to cover up fundamental problems. In this video, learn best practices and high level concepts around Kubernetes and achieving high throughput.

Replay Production Traffic to Mock local development environments

Building and debugging Kubernetes microservices can be tough, especially when you don't have realistic data or environments. See how Speedscale can quickly mock DBs and APIs based on observed production behavior, so you can debug and develop features quickly. People familiar with GoReplay will notice a more modern and automated approach to turning user behavior into reproducible developer environments.

Best Amazon RDS Alternatives For Cloud Database Management

Data is in the digital age what oil was in the industrial age. Many organizations have noticed this and are now racing to find the most efficient, cost-effective, and robust platforms to help organize, store, and manage their data. Amazon RDS offers a robust cloud database solution, but like any service, it has limitations. In this guide, we’ll explain cloud database management, how Amazon RDS supports it, and why it might not meet all needs.

Scaling Product Management for Hyper-Growth: Lessons from Cribl

Cribl has been experiencing rapid growth over the past six years as customers increasingly seek tools to modernize their data strategies. We introduced a new product, Cribl Lake, to help customers address even more diverse data management challenges. With customer data growing at a 28% CAGR, organizations are looking for solutions that can help them manage and optimize their data infrastructure.

20 years of partnership: how our partners help us take Ubuntu across industries, markets and devices

As we celebrate 20 years of Ubuntu, we wanted to take a moment to reflect on the value of partnership. The idea that software should be open source and accessible to all gave birth to a vibrant community of users and a partner ecosystem who help us take Ubuntu across industries. So who do we work with? We are fortunate to count over 100 partners, all of whom have a different relationship with Ubuntu.

Mastering Dashboard Creation: A Step-by-Step Guide

Revolutionize Your Data with Our Interactive Dashboards! Dive into a world of insightful analytics with our user-friendly dashboards, designed to help you make data-driven decisions with ease. Drag-and-Drop Interface: Effortlessly select and combine data sets and types to create stunning visualizations tailored to your needs. Chart Variety: Choose from a range of chart types like KPI, bar, line, pie and table to best represent your data.