Operations | Monitoring | ITSM | DevOps | Cloud

%term

Advanced Open edX Monitoring with AppSignal for Python

In the first part of this series, we explored how AppSignal can significantly enhance the robustness of Open edX platforms. We saw the challenges that Open edX faces as it scales and how AppSignal's features — including real-time performance monitoring and automated error tracking — provide essential tools for DevOps teams. Our walkthrough covered the initial setup and integration of AppSignal with Open edX, highlighting the immediate benefits of this powerful observability framework.

DORA Metrics in perspective

A friend of mine once had an annual appraisal where his manager blithely declared to him that his target for the next year was "to exceed his targets". Rather than spend the next year screaming silently whilst trapped inside an MC Esher-esque cycle of infinite recursion, my friend politely demurred and requested a more achievable goal, such as building a time machine out of jellybeans.

Stop Leaving Money on the Table: Boost Margin Efficiency with NinjaOne + HaloPSA

Are your managed services operating at peak efficiency? We’ll reveal how to maximize your profit margins and streamline your operations with the powerful combination of NinjaOne and HaloPSA. We'll guide you through: You’ll discover how HaloPSA’s comprehensive solution eliminates the need for multiple costly add-ons while NinjaOne’s robust endpoint management simplifies complex IT environments. Seize this chance to drive profitability and easily scale your managed services. Stop leaving money on the table.

Anodot recognized as a Visionary in the 2024 Gartner Magic Quadrant for Cloud Financial Management Tools Report

The cloud financial landscape is expanding with more vendors for companies to choose from to maintain healthy cloud costs. As the market grows, it’s important to partner with a third-party cloud financial management tool built on FinOps innovation and consistently adapt to meet future customer needs. A credible source recommending the right cloud cost tool can help you make an informed choice that positively impacts your cloud cost optimization.

Zebra DevTalk | Mobile Wallet Tech: Harnessing Apple VAS & Google Smart TAP for Innovative Apps

Learn from our Zebra expert as we dive into the dynamic world of digital wallet technology. Discover how Zebra Value Added Services (VAS) can transform your applications. This session offers an overview of the technology, explores use cases, and shows how your Android applications can leverage Apple VAS and Google Wallet technologies.

Fine-Tuning Kafka Producers and Consumers for Maximum Efficiency

Keeping Kafka running at peak efficiency takes more than just a smooth setup. Fine-tuning Kafka producers and consumers is key to making sure every message is processed quickly and accurately. A little tweaking here and there can help you avoid bottlenecks, increase throughput, and keep your whole data pipeline running smoothly. In this guide, we’ll dive into practical tips for configuring producers and consumers for maximum efficiency.

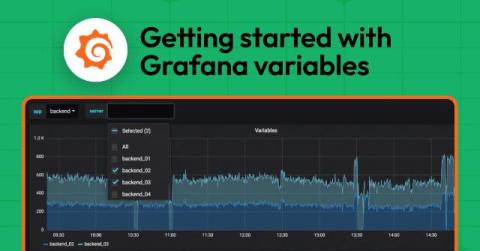
Grafana variables: what they are and how they create dynamic dashboards

A common pattern when building Grafana dashboards is to represent data for many items at once, such as simultaneously monitoring hundreds of servers. But what if there’s a problem with one of those servers? You’d want the ability to quickly identify that single server, and drill into the details without noise from all the other systems. In Grafana, dashboard variables are a great way to filter data and focus on the information that’s most important to you.