Operations | Monitoring | ITSM | DevOps | Cloud

Blog

Grafana's Explore UI: Taking a Deeper Dive into Data with Prometheus Queries

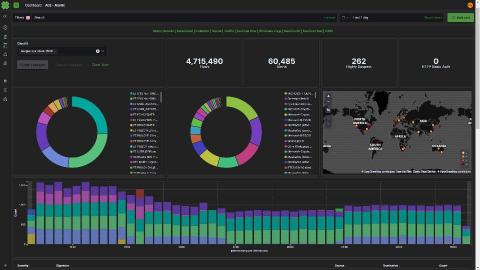
When there’s an incident, Grafana is often the starting point for figuring out a response. Users look at a time series panel and form a hypothesis. And in many situations, they’d like to dive deeper. To help make that easier, Grafana Labs has created the Explore UI, which allows you to iterate quickly through Prometheus queries, while leaving your dashboards intact.

Bridging DevOps and Traditional Operations

It’s official: Legacy IT infrastructure management (ITIM) tools have finally met their end. Several factors are combining to make existing on-premises ITIM tools nonviable in the presence of new cloud-based offerings. First and foremost, a slow but steady transition to generalists from specialists has left IT organizations with fewer experts required to manage a complex management tool.

Grafana as a Yet Another Tool for Technical Monitoring of Software Products We Build

One more article in Logicify Monitoring Tools series talks about Grafana, a software we use both for internal and external projects to visualize and analyze the data. The article could be of interest to CTOs, developers and DevOps, system administrators and Project Managers, and everyone interested.

LPWAN as a communication base for IoT

LPWAN (Low Power Wide Area Network), also known as LPWA or LPN, is a wireless data transport protocol that is now understood as one of the basic protocols for the implementation of IoT. In order to have a better idea of the relevance of LPWAN we can consider the prediction made by statisca.com of a steady increase in the number of LPWAN devices connected around the world, expecting this number to reach around 3.5 billion devices by 2021.

Honeycomb vs Elastic Stack: It's about priorities

If you’ve been paying attention, you know that although collecting and reviewing metrics and logs is a core part of running a stable and successful service, access to raw events and the ability to search and pivot on any dimension of your production environment, no matter how high-cardinality, is what will help your team debug and troubleshoot new problems and outages more quickly.