Operations | Monitoring | ITSM | DevOps | Cloud

Blog

Exception Perceptions: Automate Your Workflow with Probot for GitHub Apps

On this episode of Exception Perceptions, GitHub Community Engineer Bex Warner stopped by to chat about Probot, a framework for automating GitHub. Watch the episode, and then read what else Bex has to say about the magic of Probot. Also, check out this example of what Sentry has built with Probot.

Quantifying WordPress Performance Improvements with circonus-logwatch

Deriving meaningful insights from third-party logs has always been a difficult yet necessary task. Most analysis occurs after-the-fact, when something has gone wrong. Very few tools allow real-time monitoring of logs, so SREs have become accustomed to backfilling log data into various analysis tools. Postmortem log analysis is the de facto standard, yet should it be? Why shouldn’t you be able to monitor your server logs in real-time?

Grafana as a Yet Another Tool for Technical Monitoring of Software Products We Build

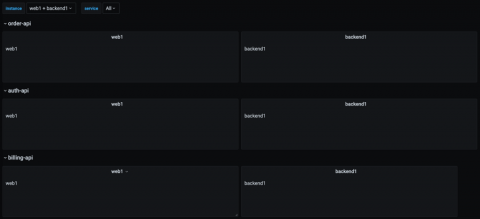
One more article in Logicify Monitoring Tools series talks about Grafana, a software we use both for internal and external projects to visualize and analyze the data. The article could be of interest to CTOs, developers and DevOps, system administrators and Project Managers, and everyone interested.

FVE8.8 What is New! - Support of VMware Cloud on AWS

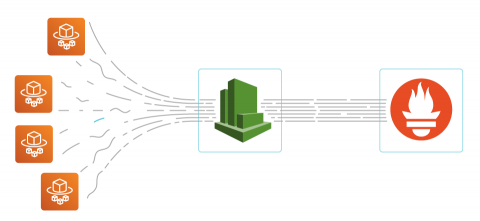
In short, VMware Cloud on AWS (VMC) provides an identical user experience with local vSphere environments while running all infrastructures on AWS. In this August, FVE8.8 has been launched with the new support of VMware Cloud on AWS. This blog will walk you through the procedure of monitoring VMware Cloud on AWS with FVE 8.8.

Empower Teams To Make Data-Driven Decisions With OpsGenie's Infrastructure & Service Health Reports

Running your organization's infrastructure and understanding how services are performing a is key to ensuring every Dev and Ops team is running as efficiently as possible. The problem? Teams typically care about different metrics, so it can be hard to track the metrics you care about when they are not located on a central dashboard. Additionally, if these metrics are in central dashboard, it is often hard to dive deep and understand the root cause of your incidents and the performance of your team.

Service Watch - Real User Monitoring for Office 365, SaaS Apps

Exoprise has long dedicated itself to excellence when it comes to synthetic (active) monitoring for cloud services like Office 365. But sometimes customers want to monitor an application that we might not support, a custom in-house application, or they want to get the perspective of an end-user that is on the road or telecommuting. That’s where our new Service Watch can come in handy.

Zapier Set Ups - Automatically export uptime data to Google Sheets

Ever wanted to keep a backup of StatusCake data without manual entry or usage of the API? This article will take you through a different and automated method of doing so for the Up and Down test alerts. This is done with the help of the Zapier service, and the data will be stored in Google Sheets.

The Best Office 365 Monitoring Now With Office 365 Reporting

Exoprise, the leader in Office 365 end-to-end monitoring, recently launched built-in reporting for Office 365. Now, the best cloud monitoring solutions includes usage, audit, activity, threat and health reporting too. No other vendor goes as deep or as wide for complete coverage of ALL of Your Office 365 operations.