Operations | Monitoring | ITSM | DevOps | Cloud

Blog

LXD pod commissioning data

MAAS is built to manage machines, including the operating systems on those machines. Enlistment and commissioning are features that make it easier to start managing a machine – as long as that machine has been configured to netboot. Enlistment enables users to simply connect a machine, configure the firmware properly, and power it on so that MAAS can find it and add it.

Customizing the UE4 Crash Report Client

Crash Report Client is an Unreal Engine tool that allows developers to capture C++ crash reports from supported platforms. At crash time, a dialog is shown to the user so that they may add comments or replication steps to the details of the report. Once the crash report is submitted, it’s pushed to one of Epic’s servers so that developers can review the crash and fix the underlying issue. Often, the crash is a result of code that wasn’t written by Epic.

Getting Started with the InfluxDB Go Client

There are several ways to write and query InfluxDB v2 (either open source or Cloud). You can use the HTTP API, Telegraf and any of 200+ plugins, or a client library. However, if you’re specifically looking to build an application with a fast way to fetch data concurrently with an easy binary deploy then — you guessed it — you’d probably want to use the InfluxDB Go Client.

Stop the world, I want to get off. Oh! It stopped...

Sitting here in my home office reflecting the potential problems the world faces both in the short term and longer term, I can’t help but think back to my career before coming to Splunk. That time was spent on the ground working ‘in the real world’, maintaining the operational and security state of systems and networks. I can empathise with the huge pressures the entire IT chain from CIOs, CISOs, IT Managers and IT admins are under right now.

Zoom in on Security in a Remote Work World

Our world has been turned upside down by COVID-19. Whether it's strategically planning our grocery run decontamination process, or trying to keep the kids quiet for even one single moment while on a conference call — things are different. One very evident difference is the change in the way we meet with each other. And one technology enabling this change is Zoom.

Working from home? So are we, Uptrends style.

The shelter-in-place requirements around the world due to COVID-19 have prevented us from getting out much, but it has also opened views into a world we probably wouldn’t see otherwise. Not only do we get glimpses into celebrity homes as we watch the news, late-night talk shows, and concerts, we get to see into the lives and homes of the people we used to see in the office every day.

Continuously manage your CircleCI implementation with Coralogix

For many companies today business success depends on quality efficient build, test and delivery processes. Development and deployment environments become complex very quickly, even for small and medium companies. A contributing factor to this complexity is companies’ adoption of microservices. This is where modern CI/CD solutions like CircleCI come in to help streamline these processes.

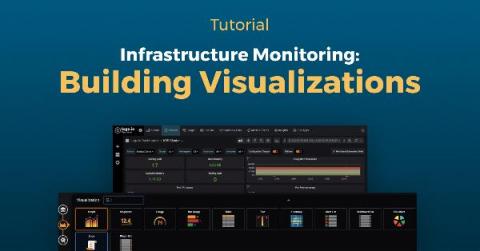
Logz.io Infrastructure Monitoring: Building Grafana Visualizations

Yesterday, my colleague Mike Elsmore wrote a blog about sending metrics to Logz.io Infrastructure monitoring – now let’s analyze them by building Grafana visualizations! Once you’ve started to send metric data to Logz.io, how do you visualize and interpret that data so that it’s useful for you? In Logz.io Infrastructure Monitoring, we use Grafana to provide dashboards and bring meaningful information to light.