Operations | Monitoring | ITSM | DevOps | Cloud

Blog

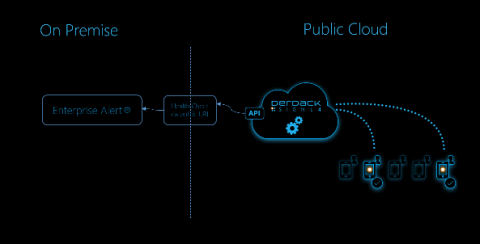
How to use SIGNL4 for availability monitoring of Enterprise Alert

Enterprise Alert is the leading enterprise-class software in automated communication and incident response providing push notifications, SMS text messages, voice calls and emails to deliver instant notifications. With two-way smart connectors, built-in duty scheduling, customizable escalation workflows, and remote actions there is not a worry that critical events are not received and are handled in a timely manner.

Network Security Monitoring with Suricata and Telegraf

At the end of 2019, we released a new Suricata input plugin with Telegraf 1.13.0. In this blog, I’ll talk about the the powerful combination of these two open source products — the importance of Suricata and why you should use Telegraf to monitor its performance. I wanted to start off first thanking Sascha Steinbiss for submitting this plugin. Here at InfluxData, we can’t tell you how much we value our open source community.

Bringing Data to Home Security With Arlo

How would you like to be in touch with what’s happening at your doorstep at all times — whether it’s a package delivery, or your loved ones arriving home — no matter where you are? Now think about the folks at Arlo, a leading home automation company, who deliver on this promise for 3.4 million homes in over 100 countries. We hear from Suma about how she uses Arlo to get notified as soon as her kids arrive home from school.

Sentry Integration Platform: Get Insights on the Integrations You Build

Early last year, we launched the Integration Platform to enable any developer to easily create integrations and workflows on top of Sentry. As we continue to build out the platform, we want to give developers visibility into how their integrations are doing. With that, we present the Integration Dashboard!

Docker container monitoring with Netdata

Properly monitoring the health and performance of Docker containers is an essential skill for solo developers and large teams alike. As your infrastructure grows in complexity, it’s important to streamline every facet of the performance of your apps/services. Plus, it’s essential that the tools you use to make those performance decisions work across teams, and allow for complex scaling architectures.

Breadcrumbs for JavaScript

Breadcrumbs can help you debug client-side JavaScript applications, and are available to all Honeybadger customers as of today. One of the things that makes fixing JavaScript errors so difficult is that everything happens on the client-side. When an obscure error happens in a callback, you often lack the context to reproduce it. If the error is critical, you may even resort to deploying debug code to get more information about the events leading up to it.

3 research-backed principles that help you scale your engineering org

As engineering teams grow, obvious difficulties arise. It’s simple math. You can’t keep up with everyone, and everything, in the same way as you did when the team was small. To maintain the high level of impact you’ve always had, your ways of working need to change.

Key metrics for monitoring AWS Lambda

AWS Lambda is a compute service that enables you to build serverless applications without the need to provision or maintain infrastructure resources (e.g., server capacity, network, security patches). AWS Lambda is event driven, meaning it triggers in response to events from other services, such as API calls from Amazon API Gateway or changes to a DynamoDB table.