Operations | Monitoring | ITSM | DevOps | Cloud

Blog

Metrics Documentation with the metrics2docs Tool

Metrictank exposes many metrics to aid with operating the software in production. As the metrictank team (the primary on-call team for metrictank at Grafana Labs) grows and onboards new people, and more customers deploy the software on their premises, we need to solve a few problems regarding the metrics exposed by metrictank.

Sentry Integration Platform: Optimizing Incident Management with Amixr

It’s hard (if not impossible) to imagine production infrastructure without incidents. And service reliability can be highly dependent on how quickly and efficiently engineers are able to tackle these incidents. Reliability engineers are often faced with four questions... Sometimes the answers to these questions are surprising.

Turbocharge QA with Pre-Production Monitoring

Traditionally, Quality Assurance (QA) has been a very manual process. Our QA teams do an amazing job running through test plans, finding critical bugs, and logging reports. But it can be a lot of work to run through the tests again and again, dig into the errors to provide the contextual information developers need to fix bugs quickly, and prepare the reports your developers need to find and fix errors in the codebase.

Understanding common library implementation

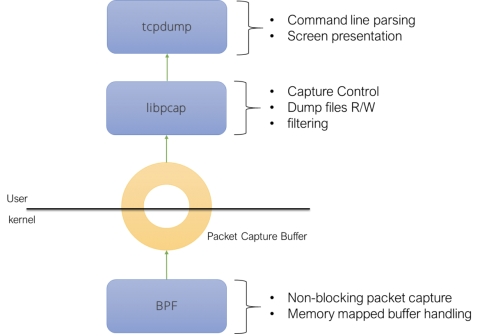
As Falco grows in popularity, many new users get exposed to it on a daily basis. As should be expected, most of these users are not aware of what the architecture underneath Falco is. What components play a role in powering it? How do these components relate to each other? I thought it would be fun to write a blog post that answers these questions. And I thought it would be fun to write it with an historical perspective.

Troubleshooting On Steroids with Logz.io Log Patterns

It’s 3 AM and your phone is ringing. Rubbing your eyes, you take a look at the alert you just got from PagerDuty. A critical service has just gone offline. Angry customers are calling support. Your boss is on the phone, demanding the issue be resolved ASAP. You open up your log management tool only to be faced by 5 million log messages. What now?

Why chat-style messaging is crucial for developer productivity

For most organizations, software development is team-driven. Good communication—messaging—is crucial to working together as a team and, increasingly, for working effectively with the tools used by the team. In recent years, instant messaging has taken over not only social networks, but also the workplace. In many ways, a collaboration tool based on instant messaging is key to collaboration, knowledge transfer, and solid teamwork.

Collecting Amazon MQ metrics and logs

In Part 1 of this series, we saw how Amazon MQ routes messages between services in a distributed application, and we looked at some of the key metrics that describe the performance of the message broker and its destinations. Now that we’ve introduced the metrics and their meaning, we’ll look at some tools you can use to collect and query metrics from Amazon MQ:

Analyzing Amazon MQ performance with Datadog

In Part 2 of this series, we showed you how to use CloudWatch to monitor metrics and logs from Amazon MQ. With CloudWatch, you can easily create ad-hoc graphs to visualize the performance of your messaging infrastructure and other AWS services you use (such as EC2, Lambda, and S3). But to monitor your Amazon MQ brokers, destinations, and clients alongside the rest of your applications and infrastructure, you need a monitoring platform that easily integrates with your whole technology stack.