Operations | Monitoring | ITSM | DevOps | Cloud

Blog

Monitoring and incident management: a winning combination

Monitoring systems gather and log a wide range of performance data on a diverse range of targets—from applications to user experience, networks, servers, and more. Usually, monitoring is conducted under runtime conditions, but synthetic monitoring can also be used to simulate loads and test the resilience of web services, for example.

Git Dos and Don'ts

It’s no surprise to learn that the team at GitKraken is passionate about Git. So passionate, in fact, that we created an educational database featuring our Learning Git with GitKraken YouTube series, educational white papers, cheat sheets, and more. And our partners at Syncfusion are no different. In a previous article, Bharat Dwarkani, technical product manager at Syncfusion, describes how the Gitflow model has simplified his organization’s development and release processes.

Track Project Milestones in GitKraken Issue Boards

GitKraken issue boards are designed to make developers more successful with intuitive project management and issue tracking. Features like Slack integration and GitHub pull request linking are just two recent examples of how the GitKraken team is constantly updating this product to enhance productivity and organization for individual developers and teams. Our latest Glo Boards release is no different; we bring you dashboards and milestones!

How to Fix a Broken Grafana Dashboard with the API

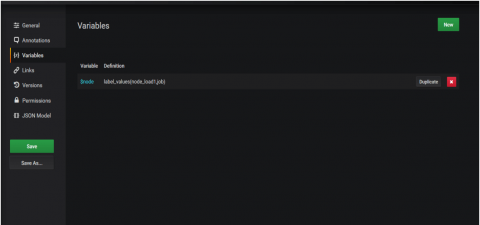
Recently, we ran into a problem where a customer’s dashboard broke to such an extent that it hung on loading. This is a really rare problem and in this case was an instance where the customer had created a variable that referenced itself. Once the dashboard is broken in this way, it is impossible to reach a screen allowing you to remove that variable. This post is not about how it was broken, but about how we resolved the error.

Opsgenie strengthens key partnerships for incident management at scale

Opsgenie was built by real people who truly understood the pain of on-call, alert fatigue, and collaboration roadblocks. We empower our customers to resolve incidents faster by leveraging the tools they already use. As part of our mission to keep your always-on services up and running, we’ve worked with three key partners to strengthen the integrations we offer. It’s important that during an incident you can use the tools you’re accustomed to.

What Is The True Impact of an IT Outage?

We live in a digital world, and it’s becoming more and more apparent every day. We rely on our smartphones to give us directions to where we need to go. We rely on email to share information with our colleagues, family and friends. We access our medical records through online portals. We even hail a rideshare through an app that connects us to drivers in locations across the globe.

IBM's journey to tens of thousands of production Kubernetes clusters

IBM Cloud has made a massive shift to Kubernetes. From an initial plan for a hosted Kubernetes public cloud offering it has snowballed to tens of thousands of production Kubernetes clusters running across more than 60 data centers around the globe, hosting 90% of the PaaS and SaaS services offered by IBM Cloud. I spoke with Dan Berg, IBM Distinguished Engineer, to find out more about their journey, what triggered such a significant shift, and what they learned along the way.

Announcing General Availability of PagerDuty's Slack Integration

When PagerDuty’s VP of Product Management Rachel Obstler announced the beta version of our new Slack integration in April in her “Anticipating, Monitoring, and Managing Incidents via Slack” panel at Slack Frontiers, we expected significant interest in the integration among our customers.