Operations | Monitoring | ITSM | DevOps | Cloud

How to

It's better to declare incidents early #incidentmanagement #sitereliabilityengineering

In this clip, Viktor Stanchev explains why it's better to declare incidents early rather than too late. Whether you’re a seasoned vet when it comes to incident response, or just getting started out, it can be easy to fall into the trap of doing too much all at once. And it just makes sense. Incident response is one of those things that doesn’t have a single, perfect formula, so teams can be left doing a little bit of everything in an effort to get it right.

Automatically update your status page when an alert is received

There are several ways to update ilert status pages. In this video, you'll learn how to do it using alert actions. We'll create a new alert action so that your status page automatically updates with a new status whenever an alert is received. Haven't tried ilert status pages yet? Get a public status page integrated with ilert alerting system for free.

How to Stream AWS Logs to Grafana Cloud via Amazon Data Firehose | Grafana

In this video, we show you the steps to configure your Grafana account so you can start streaming AWS logs to Grafana Cloud using Amazon Data Firehose. It takes just a few minutes to set up so you can see your logs in Grafana Explore. Save money and time by using this new approach!

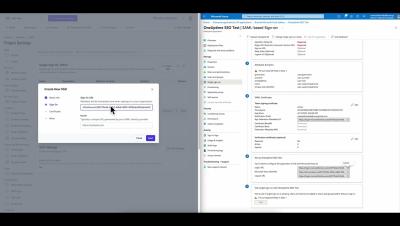
Setup SSO with Azure Entra ID and OneUptime

In this informative and easy-to-follow tutorial, we walk you through the process of setting up Single Sign-On (SSO) with Azure Entra ID and OneUptime. We guide you step-by-step on how to enable SSO for an enterprise application that you’ve added to your Microsoft Entra tenant. We cover everything from signing in to the Microsoft Entra admin center as a Cloud Application Administrator, to configuring SSO in the tenant and the application.

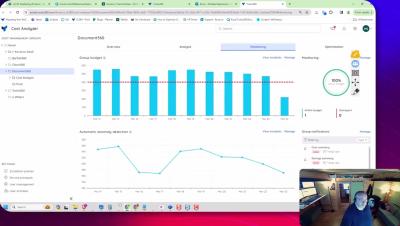
How to Setup Cost Alert Notification in Azure?

How to Setup Cost Alert Notification in Azure? In this video, Azure MVP - Michael Stephenson explains how users can set up alerts for exceeding cost thresholds within their monitoring setup, specifically focusing on a product called Document360. Michael demonstrates how users can configure email alerts to be notified when a cost threshold is breached, and he walks through the process of receiving and managing these alerts. He also mentions the ability to view incidents and analyze cost data in more detail if necessary.

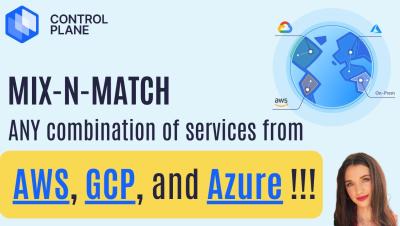
Mix-n-Match ANY combination of services from AWS, GCP and Azure

Say goodbye to cloud lock-in and hello to endless possibilities! In this walkthrough, you'll learn how to avoid vendor lock-in and optimize costs by mixing and matching services from AWS, GCP, Azure -- as if these clouds have merged. Control Plane's Universal Cloud Identity® makes it easy to consume any combination of cloud services and craft the ideal cloud environment while running apps on-premises or on any cloud, in any region.

Understanding Dashboards in Grafana | Panels, Visualizations, Queries, and Transformations

Gain a fundamental understanding of what Dashboards are in Grafana and how they can be used to visualise your data to ensure your systems remain healthy and operational. We'll cover the must know concepts, including panels, visualizations, queries, and transformations, that will ensure you have all the tools you need to build awesome dashboards in Grafana. Chapters: ☁️ Grafana Cloud is the easiest way to get started with Grafana dashboards, metrics, logs, and traces. Our forever-free tier includes access to 10k metrics, 50GB logs, 50GB traces and more. We also have plans for every use case.