Operations | Monitoring | ITSM | DevOps | Cloud

%term

It's time to stop neglecting the elephant in the room: Performance Matters!

Ralph Marsten once said, “Don't lower your expectations to meet your performance. Raise your level of performance to meet your expectations.” Many organizations today seem to follow the opposite. If everything looks green on a dashboard, they assume all is well. But is it?

All you need to know about colocation

While it’s easy to think that everything is now in the cloud, there are still some use cases and some businesses that need private data centres. In this blog, we look at the benefits of colocation and explore the key considerations for businesses when choosing colocation services. Colocation, often shortened to ‘colo’, is a service provided by data centre owners and operators where the floor space and facilities, including electricity and connectivity, are rented to private enterprises.

Deploying InfluxDB and Telegraf to Monitor Kubernetes

I run a small Kubernetes cluster at home, which I originally set up as somewhere to experiment. Because it started as a playground, I never bothered to set up monitoring. However, as time passed, I’ve ended up dropping more production-esque workloads onto it, so I decided I should probably put some observability in place. Not having visibility into the cluster was actually a little odd, considering that even my fish tank can page me.

Top 11 Grafana Alternatives [comparison 2024]

Grafana is a widely used open-source platform for monitoring and visualization. Grafana has a lot of built-in functionality and also provides a large amount of community templates that can improve your overall experience. However, Grafana requires quite a lot of configuration and the documentation can be a bit overwhelming for beginners. In this article, we explore seven alternatives that can be simpler to use and can provide seamless integration of traces, logs, and metrics.

An Ode to Events

At this point, it’s almost passé to write a blog post comparing events to the three pillars. Nobody really wants to give up their position. Regardless, I’m going to talk about how great events are and use some analogies to try to get that across. Maybe these will help folks learn to really appreciate them and to depreciate a certain understanding of the three pillars. Or maybe not.

Introducing Data Science Stack: set up an ML environment with 3 commands on Ubuntu

Canonical, the publisher of Ubuntu, today announced the general availability of Data Science Stack (DSS), an out-of-the-box solution for data science that enables ML environments on your AI workstation. It is fully open source, free to use and native to Ubuntu. It is also accessible on other Linux distributions, on Windows using Windows Subsystem Linux (WSL), and on macOS with Multipass.

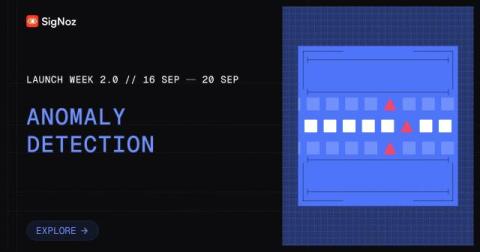
Introducing Anomaly Detection - Smarter Alerts for Dynamic Metrics

Today, we’re excited to unveil the Anomaly Detection feature. It will enable users to create smarter alerts based on dynamic metrics, moving beyond traditional fixed-threshold alerts. It will soon be available to all our users and is currently undergoing beta testing with select users. By detecting deviations from expected patterns, Anomaly Detection will help you stay informed about critical issues without getting overwhelmed by irrelevant alerts. Let’s dig in deeper.

A Next-Gen Partnership with CrowdStrike's Falcon Next-Gen SIEM

In an increasingly digital world, organizations face complex challenges in managing their security data that’s growing at a relentless pace. With the rapid growth of cyber assets and the ever-present threat of sophisticated attacks, legacy security tools often struggle to keep up.

The Layers, Not Pillars, of Observability

Remember the Tabs vs. Spaces arguments? It seems that observability has grown up enough that we are arguing over which signals are the “best” signals for observability. Often referred to as the Pillars of Observability, Metrics, Logs, and Traces (sometimes adding Events for MELT) each provide a unique perspective on a system. What happens when we change our perspective from finding the “best” telemetry format to finding the telemetry that aligns with the problems we need to solve?