Operations | Monitoring | ITSM | DevOps | Cloud

%term

Day-0, Day-1, and Day-2 Operations: What Are the Differences?

Operations are the backbone of successful software delivery, but the specifics of each phase—Day-0, Day-1, and Day-2—often get overlooked. Understanding these phases can help you streamline deployments, reduce risks, and maintain robust, scalable systems. Let’s break down what each phase entails and explore their distinct activities, tools, and best practices.

Nexthink is a Leader in the Forrester Wave

We’re thrilled to announce that Nexthink has been recognized as a Leader in the Forrester Wave: End-User Experience Management Solutions, Q3 2024 report! To us, this recognition underscores our commitment to excellence in digital employee experience and our innovative solutions that keep your workforce productive and engaged. Dive into the report to see why Forrester positioned us as a Leader and how we see Nexthink continuing to transform digital workplace strategies.

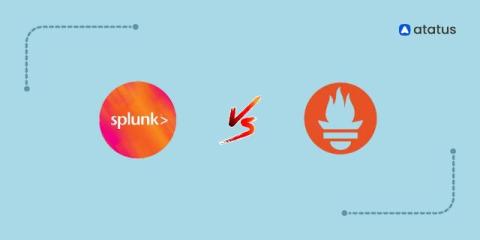
Splunk vs Prometheus: a Side-by-Side Comparison [2024 Guide]

When it comes to monitoring and observability, Splunk and Prometheus are two prominent tools with distinct strengths. Splunk excels in enterprise-level security and observability, while Prometheus is known for its efficient handling of time-series data. In this blog, I have compared these two tools, focusing on their unique features, and strengths. Remember, some insights may reflect personal preferences, helping you find the best fit for your specific monitoring needs.

Icinga Director: Cloning dictionary row entries for objects from import sources

Over use of dictionaries in monitoring leads to complex and ugly configurations. This in turn makes monitoring complicated. Hence, it is advisable to use it, only if it is needed or in special cases. Even in these cases it is worthwhile to keep it simple. On that note, in this blogpost let me demonstrate how to clone dictionary row entries for objects from import sources to object properties in Icinga Director.

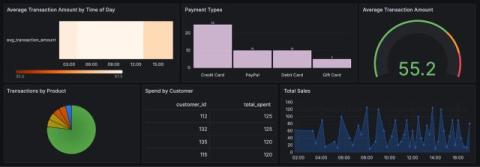
Visualize CockroachDB in Grafana: Introducing the CockroachDB Enterprise data source

We’re excited to announce the addition of CockroachDB as an Enterprise data source for Grafana. The data source, available now in private preview, enables secure and seamless access to the CockroachDB distributed SQL database, while leveraging Grafana’s powerful visualization capabilities.

How Memory Usage Patterns Can Derail Real-time Performance

In this article, we will learn how memory usage patterns can affect the real-time performance of an embedded application, drawing from a recent experience tracing an audio DSP application running on an embedded Linux platform. First, I will introduce the product in question and the real-time audio software I developed for it. Then, I’ll describe the issues I encountered with audio callbacks and the strategy I followed to determine the cause of the issues, ending with my solution and lessons learned.

MegaPod | Guilherme Soubihe, CEO of Latitude.sh

In this conversation, Michael Reid, CEO of Megaport, interviews Gui Soubihe, CEO and founder of Latitude, a company that offers Bare Metal and GPU as a Service. They discuss the growth of AI and the demand for GPU resources, as well as the challenges and opportunities in the industry. Gui shares how Latitude provides a full stack solution, combining software and infrastructure to offer a seamless user experience. They also talk about the benefits of using Megaport's connectivity services to access Latitude's GPU platform.