Operations | Monitoring | ITSM | DevOps | Cloud

%term

;( Your PC has a problem...LM Envision pinpointed the issue for IT teams immediately

The recent CrowdStrike outage highlights the urgent need for robust observability solutions and reliable IT infrastructure. On that Friday, employees started their days with unwelcome surprises. They struggled to boot up their systems, and travelers, including some of our own, faced disruptions in their journeys. These personal frustrations and inconveniences were just the beginning.

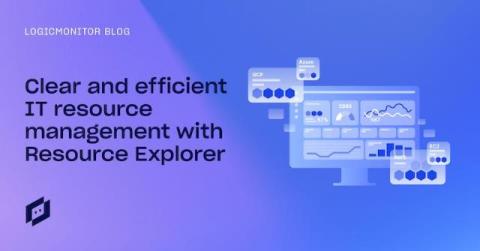
Clear and efficient IT resource management with Resource Explorer

Resource Explorer, part of LogicMonitor Envision platform, is an innovative resource management and visualization tool that helps you navigate the ever-growing number of resources in your hybrid cloud environments. In today’s dynamic IT landscape, where environments are increasingly complex and distributed, effective resource management is crucial.

5 Tips to Prevent Shrinkage in the Age of Self-Checkout

Editor’s Note: This post was originally published in September 2019. It was updated with new insights and perspectives in August 2024. Five years ago, my then-colleague and retail pundit Peter Ward explained why he was such an advocate of self-service technologies at a time when scan-and-go and self-checkout (SCO) were really starting to capture retailers’ attention (and shoppers’ interest) around the world.

How to Develop a Knowledge Management Strategy

A well-thought-out Knowledge Management strategy lays the foundation for capturing, organizing, and sharing knowledge across your organization.Think about the collective brainpower within your organization: The expertise, the experiences, the insights that make your team tick. How do you make sure that the lessons learned, the successes and the failures are shared, built upon, and used to drive growth? Developing a Knowledge Management strategy can be the key.

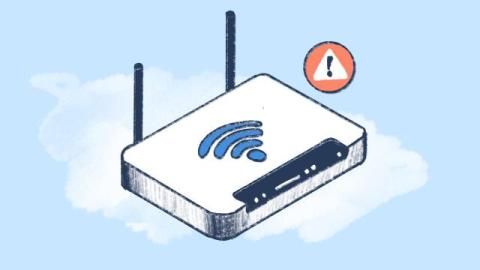
Network Management: Definition, Best Practices, and Tools

The efficiency of your IT infrastructure can make or break your business, specially in the IT world. At the core of this infrastructure lies Network Management (NM)—a critical process that ensures your network operates smoothly, securely, and efficiently. Whether you're managing a small office network or a sprawling enterprise system, understanding NM is key to maintaining optimal performance and security. But what exactly does Network Management involve? And why is it so important?

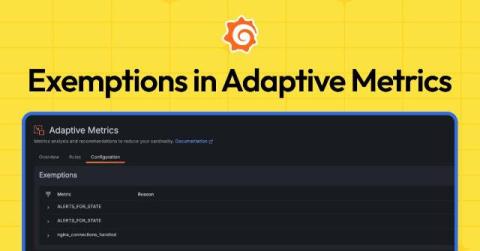
How to aggregate metrics but retain critical data: Introducing Exemptions in Adaptive Metrics

When you hear about Adaptive Metrics in Grafana Cloud, all signs point to how it’s a game changer. Adaptive Metrics, which aggregates unused and partially used metrics into lower cardinality versions, has delivered a 35% reduction in metrics costs on average for more than 1,200 organizations. Companies have also spoken candidly about the cost savings they gained from the feature.

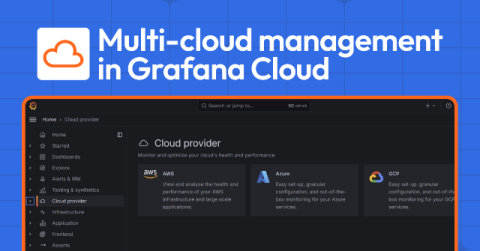
Multi-cloud monitoring made easy: monitor AWS, Microsoft Azure, and Google Cloud services all in one app

Managing multi-cloud environments often means juggling different monitoring tools for each provider, leading to increased complexity and operational overhead. To solve for that, we’re excited to introduce Cloud Provider Observability — an application for monitoring AWS, Microsoft Azure, and Google Cloud services, all in Grafana Cloud.

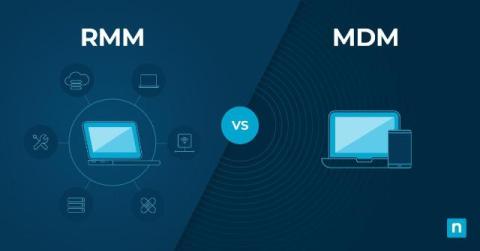
RMM vs MDM Software

RMM vs MDM software, which one is the best for you? Flexible working arrangements have become the norm for organizations. While this has significantly improved business productivity, IT departments and managed service providers (MSPs) must now keep track of a variety of endpoint devices, including mobile devices. In fact, mobile devices are rapidly becoming integral to business operations.

Building On-call: Our observability strategy

At incident.io, we run an on-call product. Our customers need to be sure that when their systems go wrong, we’ll tell them about it—high availability is a core requirement for us. To achieve the level of reliability that’s essential to our customers, excellent observability (o11y) is one of the most important tools in our belt. When done right, observability improves your product experience from two angles.

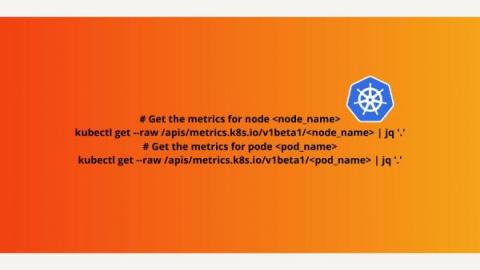
How to monitor your Kubernetes metrics server

In this article, we will examine a Kubernetes metrics server and its uses. We will also learn how to set one up and use it to monitor Kubernetes metrics. Finally, we will explore using Hosted Graphite by MetricFire to monitor Kubernetes metrics. To easily get started with monitoring Kubernetes clusters, check out our tutorial on using the Telegraf agent as a Daemonset to forward node/pod metrics to a data source and use that data to create custom dashboards and alerts.