Operations | Monitoring | ITSM | DevOps | Cloud

%term

Don't get caught in the dark: Lessons from a Lumen & AWS micro-outage

While major outages like the recent CrowdStrike incident dominate headlines, those of us in the trenches ensuring Internet Resilience know that most of our issues are not necessarily global but localized by geography, autonomous systems, or something else. Micro-outages – those elusive, localized incidents – can pose the most persistent threat to observability.

How DPM monitoring helps you manage your metrics volume

At Sumo Logic, we’re committed to helping you scale without breaking your budget. As you may have heard, we recently launched Flex Licensing, a first-of-its-kind economic model that offers free, unlimited log data ingest so different teams can capture and analyze critical data across their enterprise in one place. We’re also committed to tackling related challenges raised by other data sources — like metrics.

Understanding and Controlling AWS Transit Gateway Costs with Kentik

AWS Transit Gateway costs are multifaceted and can get out of control quickly. In this post, discover how Kentik can help you understand and control the network traffic driving AWS Transit Gateway costs. Learn how Kentik can help you understand traffic patterns, optimize data flows, and keep your Transit Gateway costs in check.

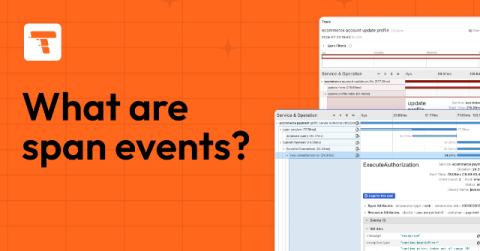
All about span events: what they are and how to query them

If you’re already familiar with distributed tracing, you know that spans are the building blocks of traces. But are you sleeping on what span events can do for you? First, you may need a wake-up call as to what a span event even is. While spans represent units of work or operation within a trace, a span event is a unique point in time during the span’s duration.

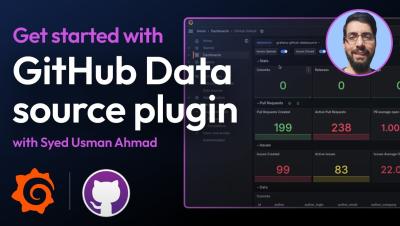
Getting started with GitHub Data source plugin - Visualize your repos | Grafana

Learn step-by-step how to monitor and visualize your GitHub data by using the Grafana GitHub Data source plugin. It provides a lot of features such as query Commits, Pull Requests, Workflows, Vulnerabilities etc. Join Senior Developer Advocate Syed Usman Ahmad in this complete video tutorial and learn to use the GitHub plugin.

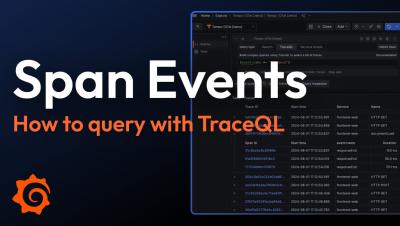
How to Query Span Events with TraceQL | Tempo Tutorial | Grafana Labs

Span events provide many benefits and can help you improve your distributed tracing game. In this video, the Grafana Tempo team goes over when to add span events to your traces. We will show you how to use TraceQL to query for span events to get useful information about your services to help you track down bugs and chase down bottlenecks faster. Grafana Cloud is the easiest way to get started with Grafana dashboards, metrics, logs, and traces.

BigPanda and ServiceNow improve IT service management

By breaking down the silos between observability, IT operations, and service management, teams can improve service delivery and enhance IT incident management. However, this is more easily said than done. The average BigPanda customer uses more than 20 observability and monitoring data sources. Combining mountains of alert data with legacy event management systems can make it almost impossible to sift through the noise to find the most important alerts.

Splunk named a Leader in the Gartner Magic Quadrant for Observability Platforms

Splunk and AppDynamics, united as part of Cisco, are driving the future of Observability. We are proud to announce that Splunk has been named a Leader in the 2024 Gartner Magic Quadrant for Observability Platforms. Splunk and AppDynamics, united as part of Cisco, are driving the future of Observability. We are proud to announce that Splunk has been named a Leader in the 2024 Gartner Magic Quadrant for Observability Platforms.