Operations | Monitoring | ITSM | DevOps | Cloud

%term

The New CloudHealth Experience and the Inform Phase of the FinOps Framework

As announced in June, the VMware Tanzu CloudHealth team has been hard at work reimaging and engineering a brand new CloudHealth user experience. We unveiled this live for the first time at FinOps X in San Diego, and were so encouraged to see the excitement and positive feedback from this first look.

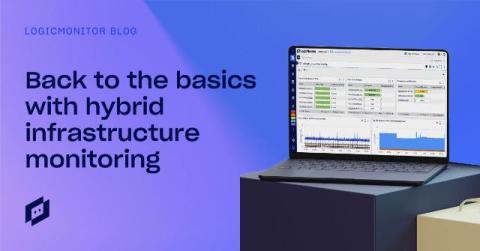
Back to the basics with hybrid infrastructure monitoring

Managing IT environments can be challenging, especially with the growing complexity of hybrid infrastructures. These interconnected technologies, including servers, routers, storage arrays, and software-defined elements running in both data centers and cloud environments, require robust infrastructure monitoring.

Intelligent Health Checks: one-click observability for reliability tests

Reliability testing and observability are similar in one important way: engineering teams know they should be doing it, but they’re not sure how to start, or they don’t have the right resources, or they need to focus on competing priorities like feature development and incident response. In an ideal world, reliability and observability would be automated processes that configure, monitor, and run themselves.

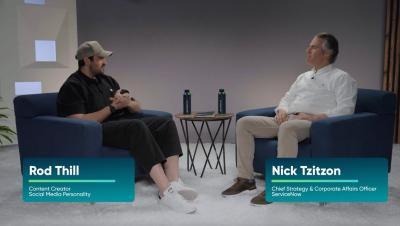
Rod Thill and ServiceNow's Nick Tzitzon debunk AI myths

Content Creator Rod Thill and ServiceNow’s Chief Strategy & Corporate Affairs Officer Nick Tzitzon sit down during Knowledge 2024 to debunk common AI myths, like whether or not artificial intelligence will take our jobs. Nick also shares his thoughts on the future of AI and how putting AI to work for people in the business world will have an impact.

How to Use and Configure Obkio's Chord Diagram | Obkio NPM Onboarding Series

Welcome to Obkio’s App! Today, we’ll be looking at the “Live Network Status” tab in Obkio’s app which shows you the live network performance of all network paths on Obkio’s Chord Diagram. The Chord Diagram is made up of Obkio’s Monitoring Agents, deployed in key network locations, as of the Monitoring Sessions, which are created between Agents.

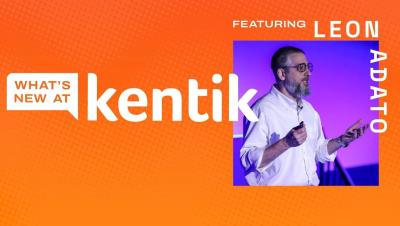
What's New at Kentik, Episode 7

Leon Adato takes us through the latest updates and features at Kentik. Learn about improvements to Kentik's search bar, explore the highlights of the recent Network Management Megatrends report, and get an introduction to our new video series, "Kentik Close-up." We also explore the Kentik API and how to use it with tools like Telegraf. Stay informed, and find out how Kentik continues to enhance network observability. Don't forget to like, subscribe, and hit the notification bell to stay updated with all things Kentik!

Why Every Engineering Team Should Embrace AWS Graviton4

Two years ago, we shared our experiences with adopting AWS Graviton3 and our enthusiasm for the future of AWS Graviton and Arm. Once again, we're privileged to share our experiences as a launch customer of the Amazon EC2 R8g instances powered by AWS Graviton4, the newest generation of AWS Graviton processors. This blog elaborates our Graviton4 preview results including detailed performance data. We've since scaled up our Graviton4 tests with no visible impact to our customers.

Recapping DASH 2024

DASH 2024 was our biggest event yet! Over two days, thousands from the Datadog community gathered at North Javits in New York City for an impactful experience. The 2024 keynote featured numerous new product launches and updates, but there was much more to enjoy beyond this speech. Attendees got to experience breakout sessions, workshops, certification exams, one-on-one Datadog consultations, and a bustling expo hall.