Operations | Monitoring | ITSM | DevOps | Cloud
%term
Auvik Roadmap Update May 2019
Using Network Visibility to Grow Your MSP Business
Get Network Device Warranty & Software Status Automatically with Auvik & Cisco
Benchmarking the Digital Workplace
How Not to Fail at Visualization
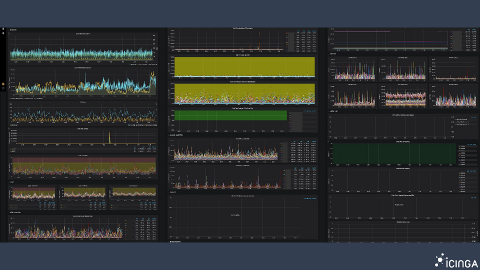
As a longtime systems engineer, Blerim Sheqa knows all about using tools like Grafana to debug issues in infrastructures. Currently the CPO of Icinga, an open source monitoring software, he gave a talk at GrafanaCon LA about how not to fail at visualization.
Goliath Technologies Delivers Unmatched Troubleshooting Capabilities in New Release
Whilst Citrix Synergy 2019 was in full-flow in Atlanta, GA, Goliath Technologies were also keeping busy with the 11.7.8 release of Goliath Performance Monitor, which adds several features that were in demand by many customers. I’ve had the chance to review this latest release, and wanted to touch on some of the features that are new to version 11.7.8, as well as cover ground on some of the features and capabilities already existing in the product today.
Prometheus and Docker: Monitoring Your Environment
Coming back from Monitorama, I had a chance to sit back and start playing with some tools to see how they worked. Prometheus is a pretty ubiquitous tool in the monitoring space, it's pretty easy to spin up, and is open-source. Having a very active community of engaged developers means finding help articles or guides is easy. We are also going to use Grafana to build nicer looking graphs based on API queries from Prometheus.
Well, Isn't That Convenient? - The 4 Cs of Quality IT Monitoring Tools
Some things in life are easy and some things are hard. Sleeping-in on weekends (provided you don’t have small children), shifting into 6th gear and ‘flooring it’ on a deserted stretch of Eastbound I-70, and taking a swig of Breckenridge Brewery’s Vanilla Porter go in the “Easy” column. What kinds of things are on the “Hard” side of the ledger?
SaneBox: Using Artificial Intelligence for Smarter Email Services
We all struggle with overloaded emails and are always on the lookout for methods to ease this burden. To make a clutter-free inbox a reality, help comes in the form of Sanebox. This is a software program made especially to clean up and effectively organize the client’s inbox. This simple software program works by taking a complete overview of your email.


