Operations | Monitoring | ITSM | DevOps | Cloud

%term

The Why Behind Modern Architectures

These days we spend a lot of time talking about modernizing our stack, modernizing our architectures, using new application components, modern application life cycles, etc. So, what is this all about and why do we spend so much time talking about it? First, there is a lot of self-serving vendor speak involved…starting with cloud providers and closely followed by open source commercialization shops and commercial ISVs (ourselves included) who have to spin the world in their own image.

Protect your user journey with Web Application Monitoring

When it comes to monitoring your user experience, it is easy to monitor and optimize just the landing pages. But, does your user’s journey end at the landing page? No. Monitoring your user journey goes deep. Each click the user makes on your site or service needs to work and be as fast and responsive as the initial page load.

Introducing granular permissions: Customize team member's access for finer control

Thousands of developers work in Raygun every day. But as the number of team members added to your organization grows, it can be tough to make sure only plan Owners have access to major plan settings in Raygun. Starting today, if you are a plan Owner, granular permissions will help you gain more control over who has access to key Raygun settings at the product, app and plan level.

Top Node.js Metrics to Monitor

Making Node.js applications quick and sturdy is a tricky task to get right. Nailing the performance just right with the V8 engine Node.js is built on is not at all as simple as one would think. JavaScript is a dynamically typed language, where you let the interpreter assign types to variables. If you’re not careful this can lead to memory leaks.

Node.js Monitoring Made Easy with Sematext

Node.js monitoring is a tricky task. There are certain challenges to look out for. Because Node.js is a dynamically typed programming language and single-threaded you give the interpreter and runtime a lot of freedom to make decisions. This can easily result in memory leaks and high CPU loads. Parallel execution is simulated in Node.js by using asynchronous execution of functions. But, if a single function blocks the thread or event queue, the application performance will take a huge hit.

How Loki Correlates Metrics and Logs -- And Saves You Money

The situation is all too familiar: You get an alert. You look at your metrics and your dashboards to try and find out what the cause might be and when the incident actually started (instead of when the alert happened). Then you have to go somewhere else to look at logs because eventually you need more data.

Automating Scheduled Down Time with the ServiceNow CMDB Integration

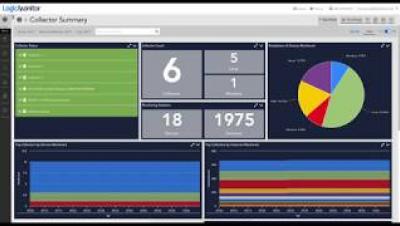
Managing CIs has become ubiquitous in the CMDB Sync landscape, but taking that connection between further and providing deeper functionality was planned from the start. This video demonstrates as recently released Update Set that combines the Change Management feature of ServiceNow with LogicMonitor’s ability to set Scheduled Down Time on Devices and Instances.