Operations | Monitoring | ITSM | DevOps | Cloud
%term
The agile guide to winning at team development
Monitor Microsoft Hyper-V with Datadog
Hyper-V is a hardware virtualization platform used to create and run virtual machines on Windows host systems. Hyper-V allocates resources from the physical hosts it runs on to the virtual machines it creates. If those resources are spread too thin, virtual machines may encounter slow performance and startup failures. With our new integration you can monitor the health of every layer of your Hyper-V stack: physical hosts, virtual machines, and all of the applications and services running on them.
Integrating Logz.io with Grafana
While Logz.io provides Kibana — the ELK Stack’s visualization tool — as part of its service, a lot of users have asked us to support Grafana. One of the leading open source visualization tools today, Grafana has some added value when compared to Kibana, especially around visualizing time-series data.
Cloud Comparison: Oracle, IBM, Alibaba
Each year we eagerly await the publication of the RightScale (now Flexera) State of the Cloud report to see which technologies and players are trending in the cloud ecosystem. In this year’s report (2019) one of the interesting takeaways is that in 2018 public cloud spending grew three times faster than private cloud and companies intend to spend almost 25% more on public cloud in 2019 than they did in 2018.
IT analytics in 90 seconds: Leverage monthly recurring revenue to enhance your MSP's business model
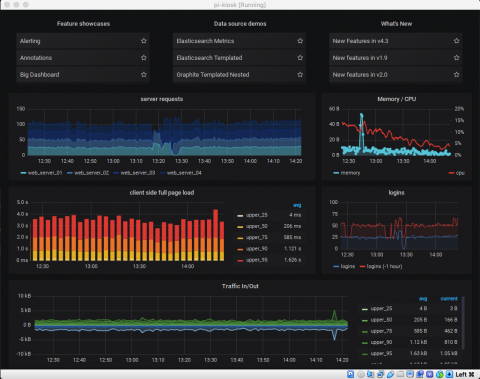
Grafana Tutorial: How to Create Kiosks to Display Dashboards on a TV
A very useful feature of Grafana is the ability to display dashboards and playlists on a large TV. Documentation on how to do this is sparse, which inspired this tutorial and also led to automating the process.
Negative TTL in AWS Cloudfront
I’m on the og-aws Slack group, one of the more active groups of AWS developers and cloud practitioners. A member of the channel, Samuell, asked a question about S3, Cloudfront, and new files, and I saw the perfect opportunity to help out, so I offered.


