Operations | Monitoring | ITSM | DevOps | Cloud
%term
StackStorm Enterprise HA in Kubernetes - eta
More groups are progressing from just talking about Event-Driven Automation to actually doing it in practice. StackStorm helps make this easy. When organizations start offloading business-critical tasks and automating for real it becomes essential to ensure that the Automation engine itself is not a single point of failure when it is responsible for recovering a fleet of servers, managing datacenters, and automating remediations.
Webinar - Live from Ignite 2018
Kubernetes and containers adoption growing fast
Cloud-native development and microservices enable development teams to work more efficiently and innovate faster. Operators appreciate the container environment because it increases infrastructure utilization, enabling them to accomplish more with less while managing critical applications at unprecedented scale. Kubernetes and containers adoption growing fast in the last few years.
Icinga 2.9.2 released
Icinga 2 v2.9 introduced performance related changes inside the configuration compilation and activation order. This was to ensure a) no unwanted notifications b) use available CPU resources to speed up the overall validation process. These changes had a bad effect on configuration depending on a specific activation order, and slowed it down with many config objects of a specific type. The Icinga Director depends on get_host() being called in service objects to support specific service set overrides.
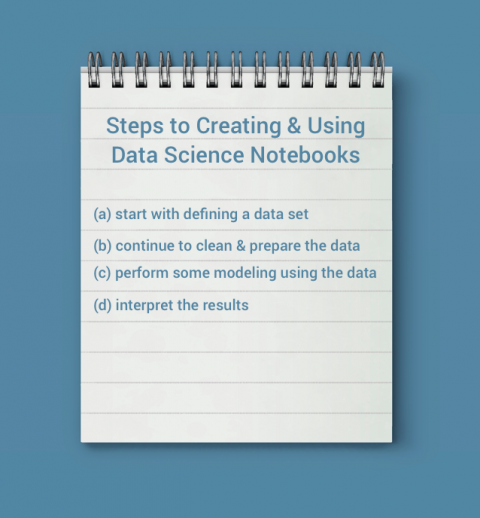
5 Best Practices for Using Sumo Logic Notebooks for Data Science
This year, at Sumo Logic’s third annual user conference, Illuminate 2018, we presented Sumo Logic Notebooks as a way to do data science in Sumo Logic. Sumo Logic Notebooks are an experimental feature that integrate Sumo Logic, notebooks and common machine learning frameworks. They are a bold attempt to go beyond what the current Sumo Logic product has to offer and enable a data science workflow leveraging our core platform.
PHP Performance: Five Types of Tools You Need To Know
To all the developers out there, it is highly advisable that every application you build should have tools that will monitor performance and ensure that it runs correctly. There are a variety of tools available that can monitor your application’s performance. Choosing the right tool that caters to your organization’s needs should be a priority.
User Interface Improvements
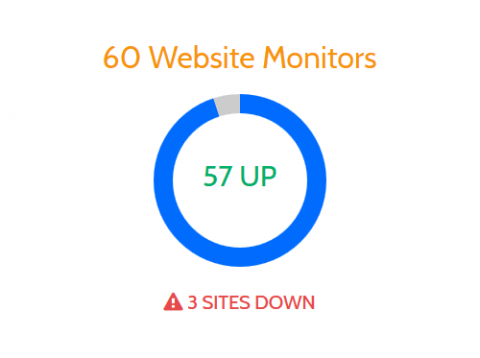
One of our main aims when developing Downtime Monkey is to make the user experience outstanding. With that in mind we've rolled out an improvement to the user interface that enables you to view the current status of all your websites at a glance.
eG Innovations Introduces Monitoring Capabilities for Microsoft Office 365 at Microsoft Ignite 2018
Iselin, NJ – September 25, 2018 – eG Innovations, a leading provider of IT performance monitoring and digital intelligence solutions, announced today that it has expanded its monitoring portfolio to deliver performance visibility of Microsoft Office 365. The new capabilities will help organizations get in-depth insights into Office 365 access, usage, connectivity and performance, and enhance end user experience and business productivity.
PagerDuty Drives Digital Operations for Atlassian Users
IT Operations, DevOps, and Developer teams count on PagerDuty’s 300+ integrations to power their end-to-end real-time digital operations, no matter which tool stack they use. Because PagerDuty’s customers span all sizes, industries, and digital maturity levels, our product team is constantly talking to customers about which tools they use for needs like communications, APM, and IT Service Management (ITSM).


