Operations | Monitoring | ITSM | DevOps | Cloud

%term

Monitoring Java applications: Memory usage, threads and other JRE metrics

In this post we will cover how to monitor the Java Runtime Environment (JRE). You will learn how to assess the performance of your Java application by profiling its memory usage, the garbage collector metrics, monitoring Java daemon and user threads and other fundamental JRE metrics. We will finish with a real Java JRE troubleshooting example using opensource Sysdig and Docker.

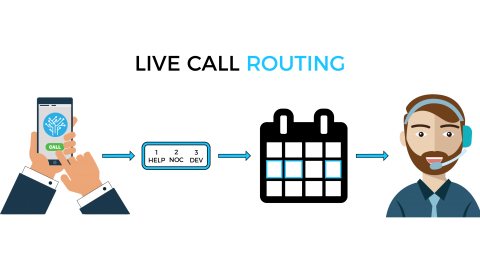
Determining Fair & Competitive On-Call Compensation

The key to choosing the best compensation plan is finding a solution that works well for your company but also recognizes the employees for their effort and time spent. If employees are well-cared for, they will, in turn, care about the business and contribute to its’ success. After choosing a method and confirming it abides by local laws, be sure to examine the following to confirm that compensation is competitive and fair and that your team can adequately share the load on-call requires.

New: Debug performance issues by comparing two IPM tests

Our Intelligent Page Monitor (IPM) is a great tool for several different reasons. It will detect element errors (e.g. 404s). It’s fantastic for AB testing. It captures a regular screenshot of your page. It runs from locations all around the world. And it’s a powerful performance monitor, giving you statistics for every element loaded on a page.

The Top 6 Cyber Threats that Keep Businesses up at Night

Few things put more fear into the hearts of IT departments than the thought of a massive cyber attack — and for good reason. In 2017, the average cost of security breaches for U.S. organizations was estimated at $3.5 million. But it’s not all about the money. In addition to the financial burden caused by cyber attacks, the loss of client trust and credibility post-breach can be extremely difficult to bounce back from.

Sysdig Monitor 3.0 - Enterprise-grade Prometheus, Kubernetes insights and more.

Today we announced the launch of enterprise-grade Prometheus monitoring with Sysdig Monitor 3.0. We’ve added new Prometheus capabilities like PromQL, a Grafana plugin and new enhancements for our already rich Kubernetes monitoring. If you love Prometheus like we do, and especially if your cloud environment is growing quickly, read on to learn more about what we’re doing with Prometheus, Kubernetes and more.