Operations | Monitoring | ITSM | DevOps | Cloud

%term

Why Move from Open Source Puppet to Puppet Enterprise? Here are 10 Reasons

Considering moving from Open Source Puppet to Puppet Enterprise? Great! In this article, we'll cover typical use cases for the enterprise version of Puppet, why businesses that moved from Puppet's open source version to Puppet Enterprise made the switch, and how customers drive time to value with Puppet Enterprise faster than Open Source Puppet.

What is Log Aggregation? A Complete Guide

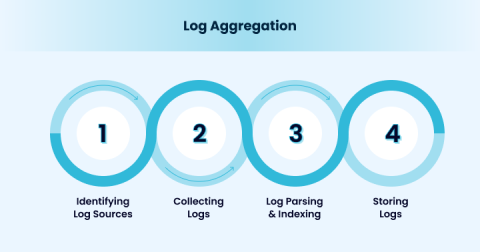
As modern IT infrastructure becomes increasingly complex, businesses generate massive amounts of logs compared to the past in real time. Therefore, streamlining this unstructured log data into a more structured form becomes vital with this growing complexity. Organizations must collect unstructured log data from various sources, extract meaning from them, and store them in a centralized repository. That’s where Log Aggregation comes in.

N-central 24.4 Release Round up | New Features and Enhancements for MSPs

Jason Murphy, Head Nerd at N-able, walks you through the latest features and improvements designed to enhance your experience with N-central. Discover the backend enhancements to drive the N-able Ecoverse vision, updates for new API's and Analytics data models. As always more performance and hardening to make your experience even better.

N-able Cloud Commander Adds | Tenant Level Settings Visibility

N-able Cloud Commander adds Tenant Level Settings Visibility, the first phase toward Secure Tenant Management. With this update MSPs and CSPs gain visibility into key Microsoft OneDrive and Microsoft SharePoint tenant level security settings, if applications using non-modern authentication is allowed, and even MDM certificate expiry. Expect more in ways of taking actions and alerting in future releases.

Troubleshooting Time Series Databases: Where Did My Metrics Go?

Complex modern applications rely heavily on observability, and metric monitoring is a crucial part of observability. The most common process of metric monitoring, which includes data scraping, processing, storage, and visualization, can be summarized in the diagram below: If an issue arises, for example, when users ask, “I have already recorded metrics in the application, why can’t I see my metrics on Grafana?”, how should we troubleshoot it?

Intelligent Alerting, Fewer Headaches: Insider View at ilert AIOps

You might have noticed that we released a series of AI-supported features last year. Intelligent alert grouping, developed to reduce alert fatigue, is the icing on the cake. ‍ With it, we combined all ilert AI features in a new powerful add-on that aims to reduce stress and give more clarity during IT incidents.

Monitor Microsoft Fabric with Datadog

Microsoft Fabric is Microsoft’s new platform for all things data analytics—integrating key Azure data analysis products like Azure Data Factory, Azure Synapse, and Power BI into a unified platform. Fabric is intended to provide a one-stop shop where users with various levels of expertise across an organization can perform data analysis and collect insights.

Feature Friday #22: Don't fix, just warn

Did you know that CFEngine can simply warn about something not being in the desired state? Traditionally with CFEngine, you define your desired state and CFEngine works towards making that happen. Sometimes you might not want CFEngine to take action and instead warn that a given promise wants to change something. Let’s take a look at a contrived example.

Control Plane's Aggregated Metrics

Metrics play a fundamental role in cloud computing, enabling the monitoring, optimization, and cost-effective operation of resources. They contribute to performance enhancement, efficient resource utilization, and overall operational excellence in the dynamic and scalable cloud environment. The Control Plane platform facilitates the collection of custom metrics from workloads, allowing applications to emit Prometheus-formatted metrics at a specified path and port. This configuration option extends to each container in a workload, providing flexibility in metrics management.