The What, Why, and How of Time Series Databases
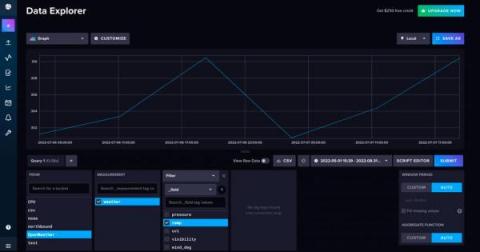
This article was written by Thamatam Vijay Kumar. Scroll down for author bio and photo. Modern-day websites are filled with dashboards featuring enriched charts, line graphs, radar as well as multigraphs. The world is fascinated with such charts and graphs, which deliver much value to millennial web applications. There are many such chart libraries which provide interactive visualization and deliver data insights for users. The charts plot the lines using data points.


