Operations | Monitoring | ITSM | DevOps | Cloud

Analytics

Made @ Elastic | Going distributed with Workplace Search

Teams around the world are going through changes. With offices closed from Hong Kong to San Francisco, Zoom meetings are the new norm, and online platforms are the standard for collaborating and keeping businesses running as usual. We’ve written about distributed work and how doing distributed well requires the right tools. When a traditional office environment isn’t available, information naturally becomes fractured across multiple single-purpose platforms.

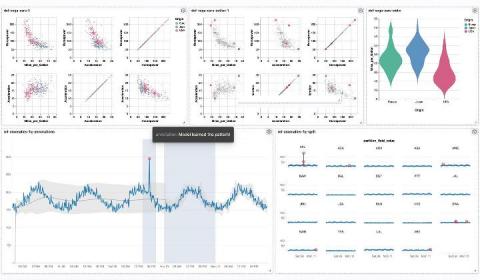
How to bring Jupyter Notebook visualizations to Kibana dashboards with Vega

In this blog post you’ll learn how to create visualizations for Kibana dashboards from Jupyter Notebooks. The good news for you as a Python developer: You won’t have to spend time writing cumbersome plain JSON documents or even JavaScript code. Under the hood, we’re going to make use of Kibana’s Vega plugin which became generally available with Elastic Stack 7.10.

Partner With Splunk on Our Data-To-Everything Journey

As we approach the end of an unpredictable year, it’s a good time to reflect on the ways data has made a positive impact. Data is helping stop human trafficking with Global Emancipation Network, connected relief resources during crises with NetHope, and saved lives during wildfires with Zonehaven. And with our powerful partner ecosystem, and the arrival of the Data Age, there is so much more we can accomplish together.

Predictions: The AI Challenges of 2021

The overall theme of Splunk’s four-part 2021 Predictions report is the rapid acceleration of digital transformation, driven by the specific event of the COVID-19 pandemic, and the momentum of data technologies that have brought us into a true Data Age. Nowhere is that acceleration going to be more transformative than around the application of artificial intelligence and machine learning.

6 ways to use analytics to deliver an exceptional end-user experience: Part 3

Welcome back to the last part of our three-part blog series on how to leverage analytics to deliver an exceptional end-user experience. In the previous blog, we discussed how analytics can help you identify the process-level inefficiencies lurking in your request resolution process and how you can provide better self-service experiences to end users by understanding their requirements better using analytics.

Amazon Connect App for Splunk

The Amazon Connect App for Splunk uses a variety of data sources to help gain insight into your contact center performance both historically and in real-time. In standard Splunk fashion, data is democratized so from DevOps and AppDev teams, to Network and Service Operations Centers, to Contact Center Operations, to Engineering and Capacity Management, there’s something in the app for everyone.

Experience Your Data in 3D with Splunk VR

Ever wanted to see and experience your data in 3D? Splunk VR unlocks the third dimension for data visualizations, so you can naturally interact with visualizations in virtual reality and find insights faster than ever before. Use Splunk VR to give your workflow an infinite canvas, free your data exploration from limited monitor screens, and display as much information as you want around you.