Operations | Monitoring | ITSM | DevOps | Cloud

Analytics

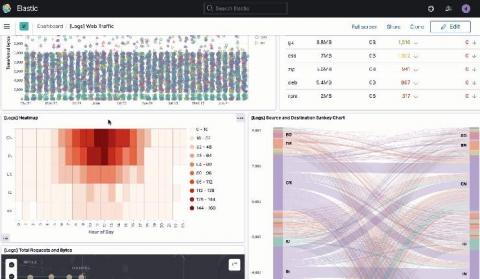
Driving dashboard actions in Kibana with URL drilldowns

With the release of Kibana 7.10, dashboards have gained a powerful new feature: URL drilldowns that let you instantly click into any predefined webpage from a visual in a dashboard. Now you can build Kibana dashboards that provide data-driven insights and allow direct actionable paths to the systems you use every day. To learn more about URL drilldowns, be sure to join us for the upcoming webinar, How to build dashboards that drive insight and action in Kibana.

Community Highlight: How to Build an InfluxDB Template

For the last few months, I have been actively contributing to the InfluxDB community by building InfluxDB Templates for InfluxDB 2.0. InfluxDB is the purpose-built time series database used for metric collection and storage. Let’s build an InfluxDB Template to monitor PostgreSQL together! 👏

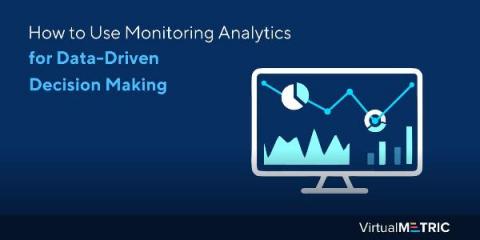
How to Use Monitoring Analytics for Data-Driven Decision Making

Data-driven decision-making is a method based on identifying and analyzing critical metrics and figures to gain insights about key issues and produce a workable solution. An essential aspect of this decision-making process is monitoring analytics that serves to quantify the performance of interconnected systems and resources for enhanced performance visibility and informed decision-making.

The Top 8 Data Analysis Mistakes To Avoid

Data analysis is incredibly useful for all kinds of businesses and also has academic and hobbyist applications. Nonetheless, it’s still possible to fall into numerous traps when trying to accurately interpret your data. That’s why we’re giving you a list of the top 8 common data analysis mistakes to avoid at all costs. Our first expert Jitin Narang, CMO at TechAHead contributed the following five top data mistakes to avoid:

6 ways to use analytics to deliver an exceptional end-user experience: Part 1

The rules of customer engagement have changed drastically in the last decade, not only for direct customer-facing roles but also for internal customer-facing roles such as technical service team staff, NOC admins, and more. Organizations across the globe are now fully aware that great customer service from support teams and NOC teams can have a lasting impact on employee productivity, morale, and in turn, the organization’s overall revenue churn and growth.

Ronald McCollam | Flux Queries in Grafana 7 | InfluxDays

In this session, Ronald shows a few new features of Grafana 7, focusing on the new native Flux query support in Grafana. He shows you how you can query with both Flux and the older InfluxQL support, using both side by side to ease migration. As a bonus, you see how to combine Flux queries with other data to perform advanced analytics and joins to truly understand your entire environment!

Air Quality Monitoring Made Easy with the InfluxDB Air Quality Monitoring Template

Air quality monitoring is important as poor air quality is responsible for an estimated 60,000 premature deaths in the United States each year, and annual costs from air pollution-related illness are estimated at $150 billion. Air quality monitoring can help track and guide action to reduce air pollution, which can cause short-term and long-term health effects for children, older adults, and people with heart disease, asthma, and other respiratory conditions.

Paul Dix [InfluxData] | Opening Keynote | InfluxDays Virtual Experience NA 2020

In this keynote, InfluxData Founder and CTO Paul Dix shares updates on InfluxDB and Flux and announces an exciting new open source project, InfluxDB IOx — a powerful storage engine designed to execute increasing query workloads over time. InfluxDB IOx lifts restrictions on cardinality, data size and cluster size – expanding the possibilities for workloads across thousands of servers and petabytes of data.