Operations | Monitoring | ITSM | DevOps | Cloud
Introduction to event-based programming
Will Serverless computing reshape big data and data science?
Serverless development has been turning heads in the market for quite some time now. But it has yet to be accepted by the majority in the development community. With AWS Lambda, Azure Functions, and IBM’s Open Whisk, the market is poised to take a different route in this field. Most of these organizations are spending a lot of money to make the market accept this new paradigm using serverless computing.
Event Highlights: InfluxDays North America 2021
Roadmap revealed, insight gained, connections made, and InfluxDB Challenge swag won — that’s a wrap for InfluxDays North America 2021! The conference, which brought together the #InfluxDB community to exchange time series acumen and use cases, is always a reminder of why and how we’ve grown. It included subject-matter-expert led courses, on-demand videos and live sessions.
How to Manage an ETL Data Migration Into the Cloud
Anodot Captures the 2021 Online Shopping Outlook from Retailers & Consumers
It’s the second holiday season since the pandemic broke out but, with many brick-and-mortar stores reopened, will it be more like 2020 or 2019? Will shoppers stick to online behemoths like Amazon or will they shop in-store? And how are retailers planning to offer a competitive experience amid ongoing supply chain issues? We partnered with Researchscape to survey thousands of eCommerce companies and consumers in the U.S. about their plans for this holiday season.
By Developers, for Developers: New Offerings Announced at InfluxDays North America
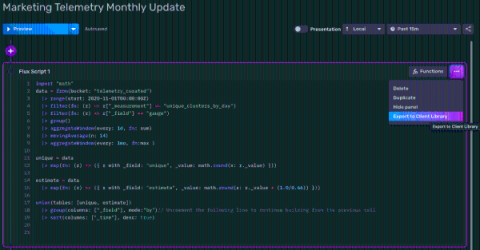
By developers, for developers – this has always been InfluxData’s approach when building new tools for users, and it’s certainly the case as we roll out the newest round of features and capabilities at this year’s InfluxDays North America. We know that application building isn’t easy and that development cycles are precious. That’s why we focus everything we do around delivering developer happiness.
InfluxData Kicks Off InfluxDays North America, Releasing New Features to Expedite Application Building
InfluxDB enhancements enable developers to get started on building real-time applications quickly and to scale SAN FRANCISCO, October 26, 2021 – InfluxData, creator of the leading time series platform InfluxDB, today announced new capabilities for developers to expedite application building as part of InfluxDays North America 2021 Virtual Experience, its annual event for customers, partners and developer community.
InfluxDB Cloud and Telegraf for the Home Lab
Home labs are popular among technology enthusiasts. Often they are unmonitored and even the smallest home lab can benefit from monitoring. This post will show how getting started with an InfluxDB Cloud account and Telegraf can make this super easy! InfluxDB is an open source time series database. As such, InfluxDB is well-suited for operations monitoring, application metrics, IoT sensor data, and real-time analytics.


