Operations | Monitoring | ITSM | DevOps | Cloud

The Go client for Elasticsearch: Configuration and customization

In a previous blog, we saw that the seemingly simple job of an Elasticsearch client — moving data between the calling code and the cluster — is actually quite complicated under the hood. Naturally, as much as we try to make the default behaviour of the client optimal for the majority of scenarios, there are situations where you want to configure, customize, or enable/disable certain features.

Community Highlight: How InfluxDB Enables IoT Sensor Monitoring of Aquariums

I recently spoke with Jeremy White who is using InfluxDB to monitor his aquariums. By collecting IoT sensor data, he has been able to better understand his 200 gallon salt-water aquarium full of fish and coral. The entire project can be found on GitHub. Caitlin: Tell us about yourself and your career. Jeremy: I’m a Senior Network Automation Consultant at Network to Code, and my background is in networking engineering. Network to Code is an industry leader in network automation.

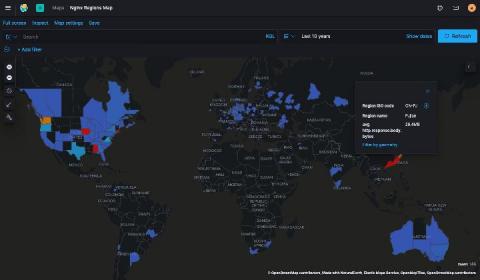
Bring new insights to your IP analytics with a global administrative layer in Elastic Maps

We love maps at Elastic. In the Elastic Stack, there is one core component of all data we visualize using maps: Location. Location can mean reporting real-time positions of fleet vehicles, using a geofence for limiting search results, gauging application performance metrics from a geographic area, or identifying security threats by attaching geographic coordinates to IP addresses.

Debugging broken grok expressions in Elasticsearch ingest processors

In two previous posts, we covered structuring data with grok and building custom grok patterns. But what happens if you just can’t get your grok patterns to work? In this article, we’re going to use Kibana’s Grok Debugger to help us debug a broken grok pattern. The divide-and-conquer method described below should help you to quickly find the reason that a given grok pattern is not matching your data.

Announcing the Elastic Contributor Program

Open source contributions are foundational to Elastic — from Elasticsearch’s Apache Lucene core to the addition of open source Logstash and Kibana to form the Elastic Stack you’ve come to know and love. Over the years, the Elastic community has created over 90 Beats, shared use case tutorials like those from Volvo, T-Mobile, and Microsoft, and presented at hundreds upon hundreds of meetups.

Putting You in Control of Your InfluxDB Cloud Spend

We recently changed the pricing of InfluxDB Cloud to let you control your cloud database spend so you spend only as much as you need to run your software and systems — with no wasted budget. If you just want a summary, check the InfluxDB Cloud pricing page. But if you’d like to nerd out on the changes we made, why we made them, and how to estimate your monthly spend on InfluxDB, then buckle up for a deep dive.

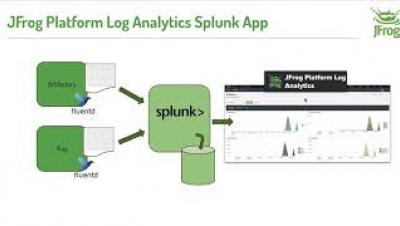
JFrog Platform Log Analytics Splunk App

The Splunk App for JFrog Platform Log Analytics processes extracted log data for the JFrog Platform, the universal, hybrid end-to-end DevOps platform. The app provides a set of operations diagnostic dashboard views for JFrog Artifactory and JFrog Xray error tracking. Learn how the Splunk app works, with some demonstration of its use.

The Go client for Elasticsearch: Introduction

The official Go client for Elasticsearch is one of the latest additions to the family of clients developed, maintained, and supported by Elastic. The initial version was published early in 2019 and has matured over the past year, gaining features such as retrying requests, discovering cluster nodes, and various helper components. We also provide comprehensive examples to facilitate using the client.

Data Layout and Schema Design Best Practices for InfluxDB

Figuring out the best data layout for InfluxDB v2 is important in optimizing the resources used by InfluxDB, as well as improving ingestion rates and the performance of queries and tasks. You also want to consider developer and user experience (UX). This post will walk you through developing a schema for an IoT application example and answer the following questions.

Introducing Quick Start guides: Getting started with Elastic Enterprise Search for free

We recently released our new training Quick Start guides for the products in the Elastic Enterprise Search solution: Elastic Workplace Search and Elastic App Search. Each product is built on the Elastic Stack, so you can enjoy its speed, scale, and relevance without the heavy development and maintenance requirements of building your own search solution. Each 15-minute video tutorial provides everything you need to start creating powerful search experiences for your workplace, websites, and apps.