Operations | Monitoring | ITSM | DevOps | Cloud

Analytics

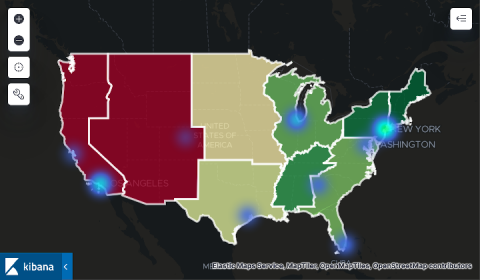
Network Security Monitoring with Suricata, Logz.io and the ELK Stack

Suricata is an open source threat detection system. Initially released by the Open Information Security Foundation (OISF) in 2010, Suricata can act both as an intrusion detection system (IDS), and intrusion prevention system (IPS), or be used for network security monitoring.

PHP Error Log Basics

When developing PHP applications, error logs tend to be underutilized due to their apparent complexity. The reality is that PHP error logs are extremely helpful, especially when configured and used properly. While there are advanced tricks to truly squeeze every last drop of utility out of error logs, this article will cover the basics of configuration and the most common use cases so you can get up and running quickly.

Bring Structure to Your Logs with Custom Parsing on LogDNA

Picture a perfect world where all logs shared the same layout, format, and structure. Every application, programming language, and logging framework created logs that were verbose, yet easily parsable. Of course, we don’t live in this ideal world, and so we’re stuck with dozens or even hundreds of various log formats. While LogDNA supports a large number of common log formats, there are formats out there that our automatic parsing engine won’t recognize.

Can Your Big Data Company Forego Anomaly Detection?

While enterprise leaders are constantly looking to innovate, there’s one area where “business as usual” should be a focus — spotting anomalies in your data. When it comes to time series data, “business as usual” is the baseline or expected behavior of the KPIs you track. Any unexpected deviations in those patterns can be classified as anomalies. However it’s important to keep in mind that anomalies can be either negative or positive.

Guide to Logging Your IBM Cloud Resources with LogDNA

We hope you’re enjoying your time at IBM Think 2019 – thank you for dropping by to chat with our team (at booth 598) and now checking our blog. As promised, setting up modern logging for your Kubernetes clusters on IBM Cloud is really easy and in this article we’ll take a closer log at IBM Log Analysis with LogDNA and how to use it to log your cloud Kubernetes clusters.

Server Monitoring with Logz.io and the ELK Stack

In a previous article, we explained the importance of monitoring the performance of your servers. Keeping tabs on metrics such as CPU, memory, disk usage, uptime, network traffic and swap usage will help you gauge the general health of your environment as well as provide the context you need to troubleshoot and solve production issues.