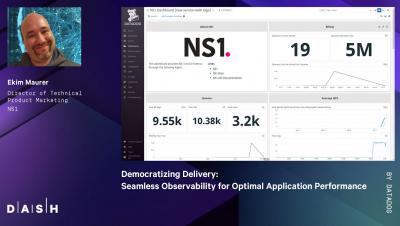
The latest News and Information on Application Performance Monitoring and related technologies.
We are proud to announce the preview release of the Elastic APM iOS agent! This release is intended to elicit feedback from the community, while providing some initial functionality within the Elastic Observability stack and is not intended for production use. Now is your chance to influence the direction of this new iOS agent and let us know what you think on our discussion forum. If you find an issue, or would like to contribute yourself, visit the GitHub repository.
To realize the full potential of APM, many customers are migrating from their existing APM 10.7 clusters to DX APM. In addition, they continue to onboard new applications for monitoring. These efforts require a series of steps, including the configuration of experience views, universes, and DX Operational Intelligence services.
In the realm of monitoring products, proactive monitoring usually means identifying potential issues within IT infrastructure and applications before users notice and complain and initiating actions to avoid the issue from becoming user noticeable and business impacting. Proactive monitoring means a business is continuously searching for signs that indicate a problem is about to happen.
The current big data world allows even tiny IT environments to produce massive amounts of information. After determining how to open up various data generation sources, a business analyzes the information. Here, the analysis method you leverage varies depending on the data, the tools/equipment used, and the use case. A good practice is to visualize the traces, weather logs, data, or metrics.
Application performance monitoring (APM) is important for the development of any web app. But monitoring software is not an easy process; you have to observe various metrics and be calculative in observing measurements like the application’s speed, error percentage, memory bloat, number of API calls per day, and much more.