Dashboards

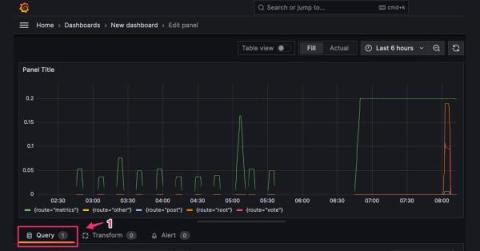
An introduction to trace sampling with Grafana Tempo and Grafana Agent

Greetings friends, one and all! Over here on the Field Engineering team, we’re often asked about tracing. Two questions that come up frequently: Do I need to sample my traces? and How do I sample my traces? The folks asking are usually using tracing stores where it’s simply not possible to store all of the traces being generated. Those are great questions and the answers depend on a few different factors.

New in Grafana 8.5: How to jump from traces to Splunk logs

The recent release of Grafana 8.5 marks the start of enabling the jump from traces directly to Splunk logs. It’s a big leap that now allows you to draw a straight line between your traces — whether they are coming from Tempo, Zipkin, or Jaeger — to even more third-party logging data, all from the comfort of your traces view. Previously, the Grafana trace to logs enablement included only Loki logs.

Monitoring next-generation maritime vessels at Royal IHC with Grafana Cloud

With a storied past in Dutch maritime history, Royal IHC is known for delivering reliable, integrated solutions for their customers. These clients rely on sophisticated vessels to create new ports, maintain navigable waters, clean up pollution, and slow shoreline erosion through the process of dredging, which involves removing sediment and debris from the water.

Monitoring Azure Stack HCI with SCOM 2022

SCOM 2022 has been recently made GA and I, coming from a SCOM background, was pretty interested in checking out the latest SCOM product. Luckily, Azure Stack HCI management packs were recently released too, so it was as if the stars had lined up for me to drop everything else and check out this new management pack with SCOM 2022. And that is exactly what I did!

How to explore and query your data with Discover

Kibana is your window into the Elastic Stack. It enables you to query the data that sits in Elasticsearch. In this video, you will learn how to search and explore your data using Discover's Document Explorer. You will see how you can search your data using Kibana Query Language, or KQL and export the results to a CSV file.

Introducing the official ClickHouse plugin for Grafana

We are delighted to introduce the new first-party ClickHouse plugin for Grafana, developed by Grafana in collaboration with ClickHouse. Grafana is committed to continuing our partnership and maintaining this plugin, and we’re excited to add more features and to grow with ClickHouse. But why Grafana + ClickHouse?

What is Kibana? (Updated Guide For 2022)

Kibana is a popular user interface used for data visualisation and for creating detailed reporting dashboards. This piece of software notably makes up a key part of the Elastic Stack alongside Elasticsearch and the extract, transform and load (ETL) tool, Logstash. In this comprehensive introduction to Kibana, we are covering all of the basics that you will need to know as a user considering using Kibana for your log data visualisation and reporting needs.

How to capture Spring Boot metrics with the OpenTelemetry Java Instrumentation Agent

In a previous blog post, Adam Quan presented a great introduction to setting up observability for a Spring Boot application. For metrics, Adam used the Prometheus Java Client library and showed how to link metrics and traces using exemplars. However, the Prometheus Java Client library is not the only way to get metrics out of a Spring Boot app. One alternative is to use the OpenTelemetry Java instrumentation agent for exposing Spring’s metrics directly in OpenTelemetry format.

How to observe your Asterisk instance with Grafana Cloud

Observability and monitoring is a fundamental part of the contact center environment. When there are thousands of live voice and other multi-channel interactions happening, it is crucial to keep a close eye on the system because any issue in service gives an instant blow to the customer experience. Asterisk is a free and open source framework for building communications applications and is sponsored by Sangoma.

Fixing SCOM's blind spots

Since its origins as MOM 2000, SCOM has been widely regarded for being awesome at two things: firstly, being the hands-down best solution for monitoring Windows Server environments (it is Microsoft’s monitoring tool, after all); and secondly, being an extensible monitoring platform that can act as a single pane of glass across your data center environment.