How to download and run Grafana on your MacOS - Grafana for Beginners Ep.4
'The Story of Grafana' documentary: The community behind the code
How do you know that your open source project has been enthusiastically adopted by the community? A) Engineers give you a raucous standing ovation when a feature is revealed. B) People form a long line to meet you at an industry event. C) Every time there is a release, social media notifications blow up your phone. If you’re Grafana founder Torkel Ödegaard, the answer is D) all of the above.
What is Grafana Loki? #observability
The Story of Grafana | Episode 2: Community | Grafana Documentary
Open source log monitoring: The concise guide to Grafana Loki
Five years ago today, Grafana Loki was introduced to the world on the KubeconNA 2018 stage when David Kaltschmidt, now a Senior Director of Engineering at Grafana Labs, clicked the button to make the Loki repo public live in front of the sold-out crowd. At the time, Loki was a prototype: We bolted together Grafana as a UI, Cortex internals, and Prometheus labels to find out if there was a need for a new open source tool to manage logs.
The Advent of Monitoring, Day 2: Debugging Dashboard Outages with Checkly's API Checks
Table of contents This is the second part of our 12-day Advent of Monitoring series. In this series, Checkly's engineers will share practical monitoring tips from their own experience. We encountered a tricky issue with our public dashboards: they were experiencing sporadic outages, happening about once every two days. The infrequency and unpredictability of these outages made them particularly challenging to diagnose.
How-to surface your multi-cloud costs with SquaredUp
Working in the cloud is certainly convenient, but the convenience comes at a price. With more and more organizations transitioning to the cloud, and a rise in preference towards cloud-native applications, hosting most, if not all the components of your business in the cloud is becoming increasingly common.
Correlate AWS and Prometheus with SquaredUp's data mesh
I recently delved into the idea of using labels within Prometheus to craft objects and hierarchies where none initially existed. Check out that piece here. The essence was harnessing the prowess of OTEL to achieve more, faster. The ambition? Transform these abstract virtual objects and integrate them into SquaredUp's knowledge graph, thereby unlocking the potential of data mesh and correlation.
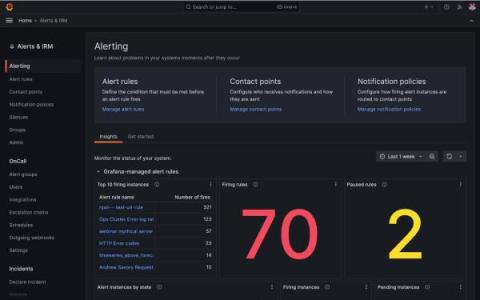
Grafana Alerting: How to monitor alerts for better alert management
With the release of Grafana 10.2, we made a number of enhancements to Grafana Alerting. These updates included the rollout of Insights, a new section of the Grafana Alerting home page. Available now to all Grafana Cloud users, Insights offers valuable information, such as statistics on alert rules and notifications, to help you monitor alerting data and quickly analyze alert performance.

