Dashboards
SCOM 2022 coming soon: the most exciting updates
Great news for the SCOM community – SCOM 2022 is going to be released in the spring! SCOM isn’t going anywhere and it’s only getting better. We saw this proven in the Big SCOM Survey Results 2021 where more than half of respondents said they were going to increase their SCOM deployment to monitor more of their existing and new infrastructure.
Discover & Dashboard Updates
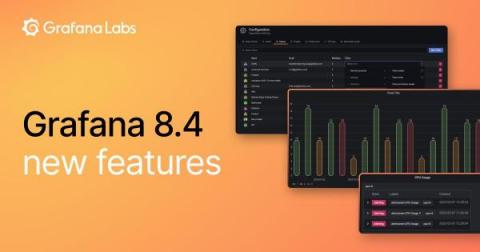
Grafana 8.4 release: new panels, better query caching, increased security, accessibility features, and more!
Grafana 8.4 is here! Get 8.4 This release includes a variety of updates focused on making Grafana easier to use, improving performance, and keeping your data secure. For a full list of new features and capabilities, check out our What’s New in Grafana 8.4 documentation. You can get started with Grafana in minutes with Grafana Cloud. We have free and paid Grafana Cloud plans to suit every use case — sign up for free now.
SCOM 2022: the most exciting updates
Technical Evangelist, SquaredUp Great news for the SCOM community – SCOM 2022 is here! SCOM isn’t going anywhere and it’s only getting better. We saw this proven in the Big SCOM Survey Results 2021 where more than half of respondents said they were going to increase their SCOM deployment to monitor more of their existing and new infrastructure.
Introducing Grafana k6 Cloud for Education, a free program to help teach performance testing
Grafana k6 is our open source tool to help you ship reliable applications by doing performance testing in a modern and developer-friendly way. Performance testing is still unknown to many, but it is not a new topic. In fact, performance testing courses are everywhere — even at colleges and universities. One of our passions is to educate others on the best practices of performance testing, working together with the Grafana k6 community.
Updates to Dashboards and Stats
Between planning, triaging tickets, negotiating requirements with external stakeholders, and actually building software, it’s hard to take the time to make dashboards or even think about the most important metrics your team needs to track. To make it easier for you to get insights into your team effectiveness and project health, we made a few updates to Dashboards and Stats that you just might like.
What are cardinality spikes and why do they matter?
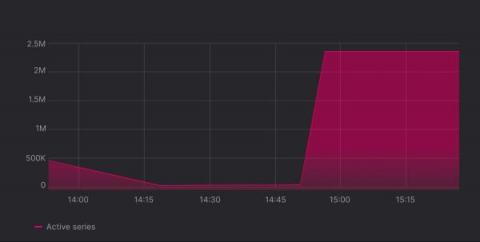
At Grafana Labs, we spend a lot of time talking to our customers, and something we’ve heard from people in a wide range of organizations is that they want to be able to better manage sudden spikes in cardinality. Here we will give you a basic overview of what cardinality is and why it’s an important factor in your observability setup, especially when there is a dramatic uptick.
Learn how to get started with Grafana Cloud, Grafana OnCall, Grafana Tempo, and the Grafana Stack
Are your metrics, logs, and traces playing hard to get in your current observability setup? Feel like your on-call messages are left on read? Is the heatmap between your data sources fizzling out on your dashboard?

