Dashboards

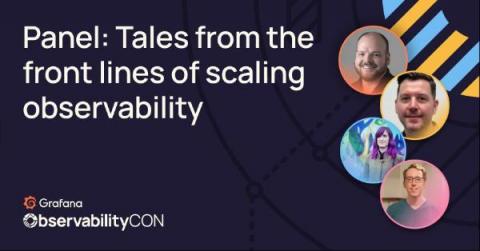
How Snyk, TripAdvisor, and Citibank use Grafana to effectively scale observability

It’s one thing to set up an observability strategy. But what’s it like to introduce and scale observability effectively across an organization? In a wide-ranging conversation at ObservabilityCON 2021, three technical pros from Snyk, TripAdvisor, and Citibank joined Grafana Labs VP Global Solutions Engineering Steve Mayzak and — with more than 75 years experience between them — they shared the triumphs and turbulence in their respective observability journeys.

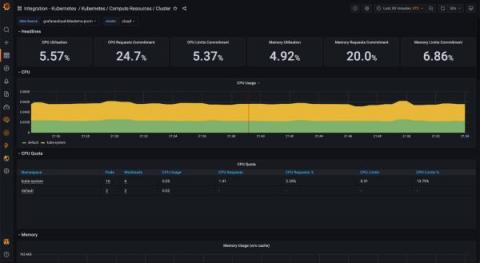
A 3-step guide to troubleshooting and visualizing Kubernetes with Grafana Cloud

Back in May, we announced the Kubernetes integration to help users easily monitor and alert on core Kubernetes cluster metrics using the Grafana Agent, our lightweight observability data collector optimized for sending metric, log, and trace data to Grafana Cloud. Since then, we’ve made some improvements to help our customers go even further.

Dashboard Fridays: Sample Symantec Endpoint Protection (SEP) Dashboard

Join SquaredUp's Adam Kinniburgh and SCOM community hero Ruben Zimmermann as they showcase this example SEP Dashboard. Giving an overview of the status of the various endpoint protection systems, this dashboard is used by the IT team to keep on top of device security, and by the service desk to escalate appropriately.

WFA: Visible - Digital Experience Index (DXI) Dashboard

If you’re not sure where to start when prioritizing investments that will have the greatest impact on user experience, this dashboard is for you! Teneo’s WFA: Visible DXI Dashboard allows you to be 5 times faster at prioritizing objectives, identifying what to improve, and reporting on improvement. #TeneoGrp

Why we created a Prometheus Agent mode from the Grafana Agent

On 2021-10-29, initial support for Prometheus Agent was merged, and it is slated for inclusion in Prometheus v2.32! This feature has a bit of a lengthy history to it: It took a little while to get to where we are today, but I’m thrilled that we were able to use the Grafana Agent code to enable agent-like functionality in the prometheus/prometheus repository.

Announcing Logz.io Unified Dashboards

In today’s cloud environments, a typical observability stack might include an Elasticsearch cluster for logging, a few Prometheus servers for metrics monitoring, and an AppDynamics deployment for APM. You may run something similar – most observability stacks consist of multiple siloed tools dedicated to collecting and analyzing specific types of monitoring data.

Discover VirtualMetric's Dashboard Playlists

VirtualMetric Real-time Monitoring Suite is supporting Dashboard Playlists, providing full visibility over your infrastructure and virtualization monitoring for your whole team. Monitoring a complex infrastructure is a hard task. We make it simple thanks to our Dashboard and a bunch of functionalities focused on your user experience, time-saving and improving the efficiency of your team.

Smarter IT Operations Through Actionable Insight

Business leaders talk excitedly about "digital transformation" and "innovative customer experience," but it falls on the shoulders of IT operations to make sure everything actually works. As transformation takes hold, IT teams manage increasingly complex, hybrid, and distributed environments – often comprising traditional on-premises systems and modern infrastructures made up of containers, multiple clouds, and virtualized networks.