Dashboards

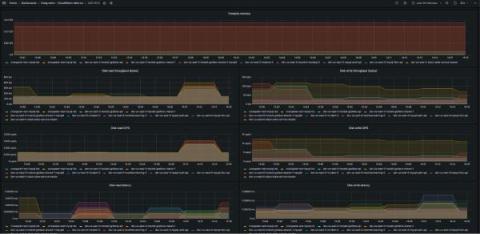
Dashboard Fridays: Sample Azure DevOps Dashboard

Join SquaredUp's Adam Kinniburgh and Azure expert Shaswot Subedi as they showcase this example Azure DevOps Dashboard. This dashboard uses SquaredUp’s WebAPI tile and data from Azure DevOps to give our DevOps Team the performance overview of our build and release pipelines that they always wanted. Tune in to learn how it was made, the challenges it solves, and our experts top tips for building it yourself.

"Open source done right": Why Canonical adopted Grafana, Loki, and Grafana Agent for their new stack

Michele Mancioppi is a product manager at Canonical with responsibility for observability and Java. He is the architect of the new system of Charmed Operators for observability known as LMA2. Jon Seager is an engineering director at Canonical with responsibility for Juju, the Charmed Operator Framework, and a number of Charmed Operator development teams which operate across different software flavors including observability, data platform, MLOps, identity, and more.

How Changelog monitors and optimizes website performance with Grafana Cloud

Developers around the world get their news from Changelog, an indie media company on a mission to create inspiring content for software developers. Through their popular podcasts, including The Changelog, Go Time, JS Party, and Ship It!, the team at Changelog helps listeners stay up-to-date on the latest happenings, trends, and tools in a constantly evolving industry.

Improve your on-call experience with Datadog mobile dashboard widgets

Life happens—even when you’re on-call. You can’t take your laptop everywhere, but whether you’re on the train, at dinner, or at the gym, you can count on the Datadog mobile app for access to key data about the status and performance of your applications. Now, you can use Datadog mobile widgets to build an on-call mobile dashboard directly on your phone’s home screen, so it’s even easier to track the data you care about from anywhere.

Learn how to build interactive dashboards with Netdata Cloud for troubleshooting systems

This video will show you how to build new dashboards with key metrics from any number of distributed systems in one place for a bird's eye view of your infrastructure. Create more meaningful visualizations for troubleshooting or keep a watchful eye on your infrastructure's most meaningful metrics without moving from node to node. Netdata’s free, open-source monitoring agent works with Netdata Cloud to help you monitor and troubleshoot every layer of your systems to find weaknesses before they turn into outages.

What's new in Grafana Cloud for October 2021: Machine Learning, Grafana 8.2, new integrations, and more

Here at Grafana Labs, we’re constantly shipping new features to help our users get the most out of Grafana Cloud. To help our new and existing customers learn about the latest and greatest, here’s a roundup of all the new features and improvements you should know about to make the most of Grafana Cloud.

Configuring Kibana for OAuth

Kibana is the most popular open-source analytics and visualization platform designed to offer faster and better insights into your data. It is a visual interface tool that allows you to explore, visualize, and build a dashboard over the log data massed in Elasticsearch clusters. An Elasticsearch cluster contains many moving parts. These clusters need modern authentication mechanisms and they require security controls to be configured to prevent unauthorized access.

How to monitor a Ceph cluster using Grafana Cloud

Here at Grafana Labs, when we’re building integrations for Grafana Cloud, we’re often thinking about how to help users get started on their observability journeys. We like to focus some of our attention on the different technologies you might come across along the way. That way, we can share our tips on the best ways to interact with them while you’re using Grafana products.

Why your log management software may not give you the real Dashboard experience

Visualizing log data is one of the biggest perks of using good log management software. Data is many businesses’ most critical asset. But, without proper use, a business’ data becomes just an artifact and no longer an asset. Visualization and analysis are the end goals of collating log data from their sources. The need for visualization arises from the fact that we intuitively process visual information faster than a random jumble of numbers and letters.