The latest News and Information on DevOps, CI/CD, Automation and related technologies.
We all know about the great things Grafana dashboards can do, and configuring them as code makes it possible to get even more out of them. These days, Grafana resources can mostly be managed as code in a declarative manner, which enables code review, code reuse, and in general, better workflows. This guide presents a few as code tools you can use to declaratively manage Grafana resources, plus some tips and tricks on how to incorporate them efficiently into your own use cases.
There are hundreds of capabilities on CircleCI that were designed to create the best possible CI/CD experience for our users. But one feature that users often point to as the most valuable on the platform is the CircleCI Insights dashboard. The Insights dashboard provides full visibility into metrics like job status, duration monitoring, and solutions for pipeline optimization.
For over 16 years, ManageEngine Network Configuration Manager has enabled network admins to manage network device configurations and validate them—all while helping them stay compliant with international standards. Today, we are thrilled to announce that ManageEngine has been named a Challenger in the 2022 GigaOm Radar for Network Validation.
Today we’re pleased to announce the availability of Kubewarden 1.4.0. Kubewarden is an open source security policy engine. This 1.4.0 version brings some minor fixes to our controller and helm charts and two new interesting features.
MDM Features for MSPs: The benefits of managed services are mostly technical. You can have access to expert help, advice, and implementation if you do not have anyone in-house. MDM solution companies are experts who can reactively guarantee the continuity of your information services in the event of a breakdown or failure. Most of the time, the managed services formulas from MSP solutions include access to technical support 24/7. Troubles can be solved with quick intervention and little downtime.
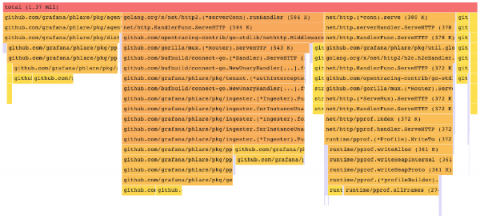
We recently announced a new open source project called Grafana Phlare. This highly available continuous profiling data source is built into Grafana core, allowing you to seamlessly monitor your profiling data. With continuous profiling, you can see which parts of your applications are consuming the most resources. You can then use that data to make any necessary tweaks to reduce consumption, which translates to lower costs.