Operations | Monitoring | ITSM | DevOps | Cloud

The latest News and Information on DevOps, CI/CD, Automation and related technologies.

How Grafana and Prometheus work together

Let us get an insight on how Grafana and Prometheus work together for monitoring metrics. Application monitoring is a crucial feature for any successful software offering. Application monitoring in its simplest form refers to collecting metrics on an application and using those metrics to gain an insight to improve the performance and efficiency of the application. Think of it as a cycle. Grafana and Prometheus are probably the most prominent tools in the application monitoring and analytics space.
AWS Fargate monitoring with Datadog

In Part 1 of this series, we looked at the important metrics to monitor when you’re running ECS or EKS on AWS Fargate. In Part 2 we showed you how to use Amazon CloudWatch and other tools to collect those metrics plus logs from your application containers. Fargate’s serverless container platform helps users deploy and manage ECS and EKS applications, but the dynamic nature of containers makes them challenging to monitor.

How to collect metrics and logs from AWS Fargate workloads

In Part 1 of this series, we showed you the key metrics you can monitor to understand the health of your Amazon ECS and Amazon EKS clusters running on AWS Fargate. In this post, we’ll show you how you can: You can use Amazon CloudWatch and related AWS services to gain visibility into your ECS clusters and the Fargate infrastructure that runs them.

Key metrics for monitoring AWS Fargate

AWS Fargate provides a way to use AWS container orchestration services—Amazon Elastic Container Service (ECS) and Amazon Elastic Kubernetes Service (EKS)—without needing to provision and maintain the infrastructure that runs your containers. Fargate is similar to serverless container platforms from Google (Cloud Run) and Microsoft (AKS virtual nodes).

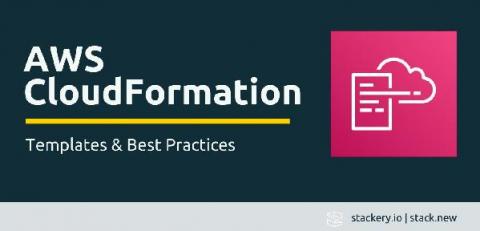
AWS CloudFormation Templates & Best Practices

What if I told you that a text file could help you tackle the normally tedious and time-consuming task of setting up and managing your AWS infrastructure? Good news. It’s actually easy to do with an AWS CloudFormation template. A typical AWS infrastructure can consist of numerous resources that might need to be managed across different accounts and regions. Setup is often a manual process that can be overwhelming to maintain.

How High Performing Teams Automate Artifact Management and CI/CD

Join CircleCI and JFrog as we discuss best practices for artifact management, security analysis and quality assurance in continuous integration and continuous delivery (CI/CD). Learn how high performing development teams utilize CircleCI and JFrog to speed up their development process and deliver better code, faster and with confidence.

Accelerate Cloud Adoption with CircleCI and Altostra's No-Code Infrastructure Platform

IaC languages like CloudFormation have made cloud management more efficient at scale, but have also added layers of complexity and more risk for human error. To get to market fast, developers need to accelerate software delivery while ensuring quality. CircleCI’s industry-leading CI/CD platform seamlessly integrates with Altostra’s no-code infrastructure to simplify cloud application development, leaving no room for error.