Operations | Monitoring | ITSM | DevOps | Cloud

The latest News and Information on DevOps, CI/CD, Automation and related technologies.

Rancher Labs Industry Survey Shows Rapid Adoption of Containers and Kubernetes, But Challenges Remain

To get an accurate picture of the current state of Kubernetes deployments, Rancher Labs recently conducted an industry survey that included 1,106 respondents from large and small enterprises across a broad range of more than 25 industries, including technology, financial services, telecom, education, government and healthcare. The respondents were almost evenly split among EMEA and North America and included both Rancher and non-Rancher users.
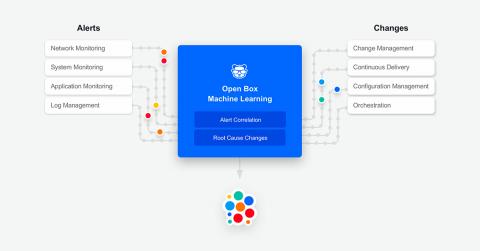
Meet Root Cause Changes from BigPanda - IT Ops, NOC and DevOps Teams' Best friend For Supporting Fast-Moving IT Stacks

TL;DR: Fast-moving IT stacks see frequent, long and painful outages. Thousands of changes – planned, unplanned and shadow changes – are one of the main reasons behind this. Until now, IT Ops, NOC & DevOps teams didn’t have an easy way to get a real-time answer to the “What Changed?” question – the answer that can help reduce the duration of outages and incidents in these fast-moving IT stacks. Now, with BigPanda Root Cause Changes, they do.

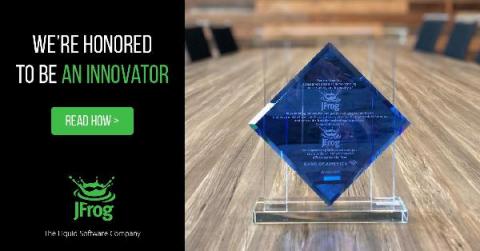
We're Honored: Bank of America Recognizes JFrog for Enterprise DevOps Innovation

Being innovative is like being handsome. It only counts when others think so. When Bank of America honors you for being innovative and improving how their 30,000 developers perform, it’s a very handsome compliment. At the 11th Bank of America Technology Innovation Summit, JFrog was recognized for industrial leadership and excellence in providing global business solutions. This year, JFrog was one of only two technology companies honored for its strong partnership with the firm.

How to Create an Azure Monitor Alert

Azure Monitor gathers performance metrics from your various Azure resources and allows you to explore those metrics through visualizations. It also allows you to manually create alerts that will notify you when a metric crosses a predefined threshold. In this blog post, we’ll cover how to create an alert in Azure Monitor.

Collecting Amazon MQ metrics and logs

In Part 1 of this series, we saw how Amazon MQ routes messages between services in a distributed application, and we looked at some of the key metrics that describe the performance of the message broker and its destinations. Now that we’ve introduced the metrics and their meaning, we’ll look at some tools you can use to collect and query metrics from Amazon MQ:

Analyzing Amazon MQ performance with Datadog

In Part 2 of this series, we showed you how to use CloudWatch to monitor metrics and logs from Amazon MQ. With CloudWatch, you can easily create ad-hoc graphs to visualize the performance of your messaging infrastructure and other AWS services you use (such as EC2, Lambda, and S3). But to monitor your Amazon MQ brokers, destinations, and clients alongside the rest of your applications and infrastructure, you need a monitoring platform that easily integrates with your whole technology stack.

Monitor your Fargate container logs with FireLens and Datadog

To centralize logging from your entire stack—from traditional infrastructure to serverless components—Datadog is announcing native support for the launch of FireLens for Amazon ECS. FireLens streamlines logging by enabling you to configure a log collection and forwarding tool such as Fluent Bit directly in your Fargate tasks. We’ve partnered with AWS to provide built-in Fluent Bit support for Datadog so that you can now seamlessly route container logs from AWS Fargate.

What's in a serverless developer's environment?

I often get asked what software tools are ideal for a serverless developer. I like being asked for my tooling preferences as much as the next developer gal, but when you break it down, this particular question is flawed. Serverless is, after all, about using a massive suite of platform tools to let you do minimal management.

Major Media Take Notice of the Virtana Unveiling

It’s been almost two weeks since we said goodbye to Virtual Instruments, and hello to Virtana – a company focused on helping customers take a modern, AIOps-empowered approach to managing their hybrid IT infrastructure. As part of introducing the world to Virtana, we also announced the launch of the latest addition to our portfolio of hybrid infrastruture monitoring solutions – CloudWisdom.