Automatically Sending Kafka Messages to Email or Slack Channel using Software Bots
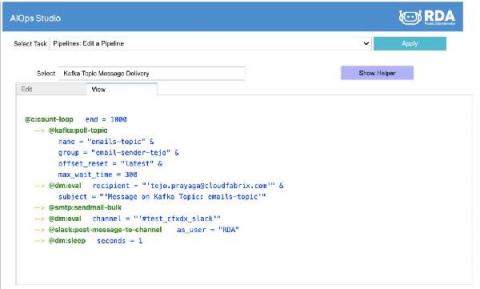
If you want to automatically send Apache Kafka messages to an Email recipient or a Slack channel, it is very easy to do with our new Software Bots.


Today’s business is powered by data. Success in the digital world depends on how quickly data can be collected, analyzed and acted upon. The faster the speed of data-driven insights, the more agile and responsive a business can become. Apache Kafka has emerged as a popular open-source stream-processing solution for collecting, storing, processing and analyzing data at scale.
In a previous blog post, "Monitoring Kafka Performance with Splunk," we discussed key performance metrics to monitor different components in Kafka. This blog is focused on how to collect and monitor Kafka performance metrics with Splunk Infrastructure Monitoring using OpenTelemetry, a vendor-neutral and open framework to export telemetry data. In this step-by-step getting-started blog, we will.
Over the last few months, Honeycomb’s platform team migrated to a new iteration of our ingest pipeline for customer events. Our migration to this newer architecture did not go too smoothly, as can be attested by our status page since February. There were also many near-incidents where we got paged and reacted quickly enough to avoid major issues. We’ve decided to write a full overview of all the challenges we had encountered, which you can can download.
Today, we are pleased to announce a partnership with Confluent to jointly develop and deliver an enhanced product experience to the Kafka-Elasticsearch community. Kafka is — and has been since the very early days — an important component of the Elastic ecosystem.
Kafka is a distributed, highly available event streaming platform which can be run on bare metal, virtualized, containerized, or as a managed service. At its heart, Kafka is a publish/subscribe (or pub/sub) system, which provides a "broker" to dole out events. Publishers post events to topics, and consumers subscribe to topics. When a new event is sent to a topic, consumers that subscribe to the topic will receive a new event notification.