Operations | Monitoring | ITSM | DevOps | Cloud
How real-time chat helped financial institutions respond to COVID-19
The first few weeks of COVID-19 lockdowns were chaotic for organizations in every industry. As financial institutions adapted and responded to the COVID-19 outbreak, many security leaders turned to FS-ISAC’s Connect app, the real-time chat feature powered by Mattermost, to connect with other teams and collaborate on response plans.
Find the Path to Go Module Major Versions With GoCenter
Instant Test Integration with Slack
In this week‘s Tip of the Day, we’re going to explore more of Catchpoint’s third-party integrations. Last week, we discussed how Catchpoint can be integrated with existing collaboration tools focusing on Slack. The demo walked through the process of setting up an integration with the communication platform, specifically how to feed Catchpoint alert data into a Slack channel.
2020: The Year Bee-hind Us
Hey, observability friends. I’m Shelby. I joined Honeycomb back in March. This year I’m carrying the torch of our annual tradition, looking back at the Year Bee-hind Us. Cue up the Auld Lang Syne. This wasn’t easy to write. Everyone at Honeycomb has been affected by the events of this year: the pandemic plus lockdown, school closures, complete life upheaval. We’ve witnessed or directly experienced racist injustice, social unrest, and state violence.
How to migrate from self-managed Elasticsearch to Elastic Cloud on AWS
Increasingly, we are seeing on-prem workloads being moved onto the cloud. Elasticsearch has been around for many years with our users and customers typically managing it themselves on-prem. Elasticsearch Service on Elastic Cloud — our managed Elasticsearch service that runs on Amazon Web Services (AWS), Google Cloud, and Microsoft Azure across many different regions, is the best way to consume the Elastic Stack and our solutions for enterprise search, observability, and security.
Automation Made Easy: What's New with Splunk Phantom
The Splunk Security Team is excited to share some of the new and enhanced capabilities of Splunk Phantom, Splunk’s security orchestration, automation and response (SOAR) technology. Phantom’s latest update (v4.10) makes automation implementation, operation and scaling easier than ever for your security team.
4 Predictions About What's in Store for IT in 2021
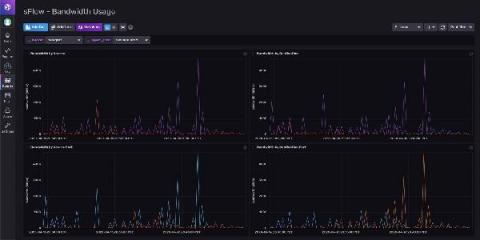
Network Usage Visibility from the Free InfluxDB sFlow Monitoring Template
As business-critical applications increasingly rely on network services, even a minor change in network usage can impact network performance and reliability, thereby also impacting business functions and network maintenance costs. sFlow (short for “sampled flow”) — by providing unprecedented visibility into network usage and active routes of high-speed and complex networks — delivers the data needed to effectively control and manage network usage.
Slack outage 2021 welcomes everyone back to work
It’s a new year and what better way to start working from home for the 10th month of the pandemic than with a Slack outage. For more than 3 hours on Monday 4th January, Slack users were left to fend for themselves with the use of none other than emails! to communicate with their teams – a notion that was surely lost by the 2010’s.


