Operations | Monitoring | ITSM | DevOps | Cloud
The 'What' and The 'How' of an Effective Monitoring Dashboard
The Network Monitoring Dashboard is critical for your users to process, interact with, and analyze data. While most enterprise teams understand the essentiality of dashboards, they often fail to maintain the efficacy of a well-designed dashboard. A common phenomenon among dashboards is that even the most sophisticated-looking dashboards, embedded with colorful graphics, can be deceptive and uninformative for the decision-making process.
A Look Back At Console Connect In 2020
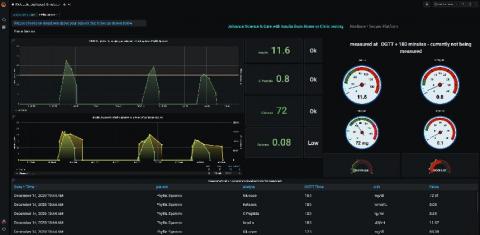
How Grafana is helping the DIFFERENCE Foundation visualize medical data in their fight against a global pandemic
The DIFFERENCE Foundation is a non-profit organization based in the Netherlands that is focused on designing, guiding, and funding highly quantitative research on metabolic dysfunction. The foundation considers metabolic dysfunction—which can trigger obesity, diabetes, many other diseases—the original global pandemic, as it affects almost one quarter of the global population.
Speed Up Development with Automated Kubernetes Deployments
Are you or your team currently looking for your next-generation architecture? Or perhaps are you already there, but looking for the best way to automate and manage it. In this blog, we’re going to talk about deploying Rancher environments using the power of env0. Rancher is a complete software stack for teams adopting containers.
5 Keys To Management Visibility in a Service Organization
Management visibility is critical. Over and over again, communication survey results paint a vivid picture of employees that want to truly connect with their senior leaders, feel engaged in the company's strategic direction, and be respected and trusted. Hearing from the boss is proven to be an essential foundation for creating satisfaction for employees, particularly in a service organization that requires high levels of leadership and employee trust.
Artificial Intelligence vs Machine Learning in Technology
As children we believed in magic, imagined, and a fantasy where robots would one day follow our commands, undertaking our most meager tasks and even help with our homework at the push of a button! But sadly it always seemed that these beliefs, along with the idea of self-driven aero cars and jetpacks, belonged in a future beyond our imagination or in a Hollywood Sci-fi. Would we ever get to experience the future in our lifetime?
Coordinated disclosure of XML round-trip vulnerabilities in Go's standard library
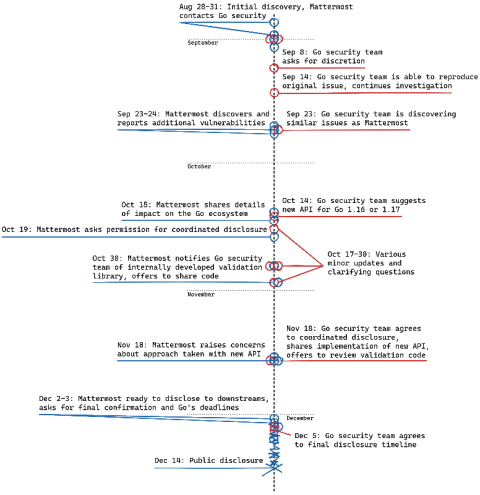
This blog post is a part of Mattermost’s public disclosure of three serious vulnerabilities in Go’s encoding/xml related to tokenization round-trips. The public disclosure comes as a result of several months of work, including collaborating with the Go security team since August 2020 and with affected downstream project maintainers since earlier this month.


