Operations | Monitoring | ITSM | DevOps | Cloud
What Are Some Common Mac Problems You May Encounter?
Building a Multi-tenant Ruby on Rails App With Subdomains
According to a definition of multitenancy, when an app serves multiple tenants, it means that there are a few groups of users who share common access to the software instance. An excellent example of an app that supports multitenancy is the Jira platform, where each company has its subdomain to access the software, for example, mycompany.atlassian.net.
The Benefits & Features of Obkio's Windows Network Monitor
Obkio users can now install Network Monitoring Agents on their Windows computers to collect network performance data and view it right on the Obkio app. Keep reading to learn all about the Windows Agents, including some key features and benefits.
Setting up IT budget for 2021
The global COVID-19 pandemic crisis has proved to be a catalyst for change for organizations. Businesses have been spurred to continue investing more in IT budget to secure and support their remote workforce operations in spite of slow revenue growth due to the pandemic. According to a survey of more than 1,000 businesses by Spiceworks Ziff Davis, 76 percent of them plan on implementing long-term IT changes in their IT budget and 44 percent plan on accelerating their digital transformation plans.
Netdata and StackPulse: Per-second metrics meet automated remediation
Teams of all types use Netdata to monitor the health of their nodes with preconfigured alarms and real-time interactive visualizations, and when incidents happen, they troubleshoot issues with thousands of per-second metrics on Netdata Cloud. But based on the complexity of the team and the infrastructure they monitor, some parts of their incident management, such as pre-planned communication and escalation processes, or even automated remediation, need to happen outside of the Netdata ecosystem.
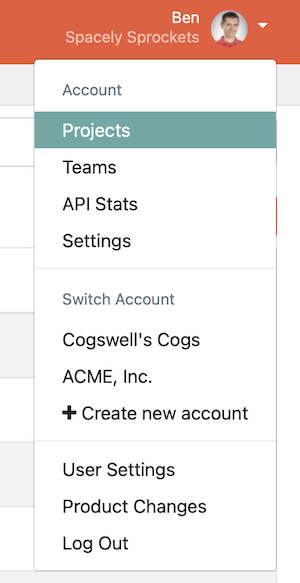
A big change: Accounts
In which we discuss upgrading our quirky billing system.
Jaeger Essentials: Introduction to Jaeger Instrumentation
Every journey in distributed tracing starts with instrumenting an application to emit or extract trace data from each service as they execute. There are many ways to instrument, including the use of SDKs and pre-configured frameworks, and many protocols for transmitting the trace data to the analysis tool.
Community update: Discourse, community efforts
Open source and community have always been in the DNA of Netdata, with the Agent starting as a very popular open-source project. Since then, a lot has changed, with Netdata maturing into a company, and the Netdata Agent finding its place as an open-source project in a wider offering that redesigns the monitoring experience from the ground up.
10 Tips for Increasing Operational Efficiency
Operational efficiency is crucial to the success of your company. Improving efficiency is a combined effort of measuring and refining processes, employees, technology, and financials. The goal is the continual improvement of these aspects to maintain and increase your business’s operational efficiency. Do you want to learn more about enhancing your operational efficiency? Check out StartingPoint, the platform for customer success and service management!


