Operations | Monitoring | ITSM | DevOps | Cloud

Latest Posts

Sending Nagios alerts to Microsoft Teams and rapid incident response with Zenduty

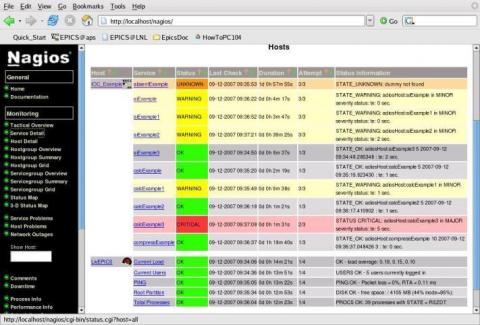
Nagios is one of the most widely used open-source network monitoring software used by thousands of NOC teams globally to monitor the health of a vast array of their hosts and services. Most teams rely on Emails as their primary Nagios alert notification channel, which may take a few minutes to respond to by your NOC team.

Product Metrics for Discovery Activities

Most companies today compile a set of metrics for their product teams to regularly report on to the company management. This includes a variety of product performance metrics(usage frequency, churn rate, NPS, etc.). But a lot of them struggle a bit with product discovery activities. So how do your track discovery?

Two tips to incorporate the voice of the customer in your story grooming/sprint planning

Constantly talking to your users about their business problems and incorporating those solutions is key to the success off your product and company. There are many ways to incorporate the voice of your users into your product planning. Formulate an experience brief that’s less than 2 pages, or a 5-minute clip of user interviews. The best is to have devs in the interviews and discovery activities with you as well.

Learning from Incidents - what to do after you write a postmortem?

For folks who’ve made post mortems more meaningful at your company, it is important that you spread that learning around. A lot of companies have teams that do postmortems really well and a lot of engineering managers(EMs) want to spread it organically, but writing and following postmortems is the kind of practice that a lot of devs really just don’t think about or care about and it can get extremely hard to force this practice, especially without support from upper management.

Disaster recovery in AWS, GCP and Azure - thoughts on capacity planning and risks

One of the most popular cloud disaster recovery models in the industry today is the “pilot light” model where critical applications and data are in already place so that it can be quickly retrieved if needed. A simple question one must ask before adopting this model is what thought has been given to whether the AWS/GCP/Azure APIs will work and if the requisite capacity will be available in the alternate region.

Prometheus for multi-cluster setups

This tip is for those who are using Prometheus federation to monitor multiple clusters. How should alertmanager be configured for multiple clusters? Let us say that if there’s an issue for Cluster A it only needs to send an alert for cluster A? In such cases, every alert should be routed to proper team based on labels (if there is problem with application A on cluster B - team responsible should be notified). In the above case, two alerts are triggered by the same rule.

Trust-building elements to increase conversion rates

In order to have a pipeline with great conversion rates, one must integrate a number of design and copy updates into your application funnel for trust-building and user empowerment. These are also called service evidence, a term comes from The Design of Everyday Things by Don Norman.

Using context to triage change-triggered incidents

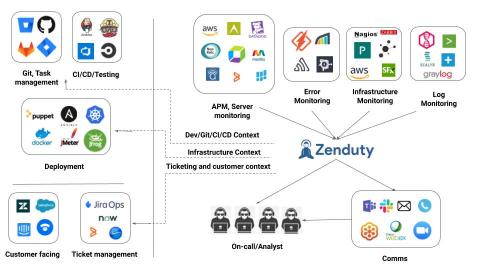
One of the first things incident managers do when they get an alert page from Zenduty is to check the “Context” tab of the incident. Incident context is extremely critical to get a first responder’s view of what happened and what could possibly have caused it. Context tells you what happened before an incident. In the case of 40–50% of all incidents, Zenduty’s incident context can tell you within 5–10 seconds, what could be the cause of an incident.