Operations | Monitoring | ITSM | DevOps | Cloud

Latest Posts

Monitor Juniper network devices with Datadog

Juniper Networks provides a range of IT network and security devices, including routers, switches, access points, and firewalls. As you scale your on-prem infrastructure with potentially thousands of devices distributed across multiple locations, getting visibility into your entire network can easily become a pain point.

Accelerate your logs investigations with Watchdog Insights

If you’re investigating an incident, every minute means degraded performance or even downtime for customers. The causes of an issue often come from parts of your systems and applications that you would not think to check, and the sooner you can bring these to light, the better.

Key metrics for monitoring AWS Fargate

AWS Fargate provides a way to use AWS container orchestration services—Amazon Elastic Container Service (ECS) and Amazon Elastic Kubernetes Service (EKS)—without needing to provision and maintain the infrastructure that runs your containers. Fargate is similar to serverless container platforms from Google (Cloud Run) and Microsoft (AKS virtual nodes).

How to collect metrics and logs from AWS Fargate workloads

In Part 1 of this series, we showed you the key metrics you can monitor to understand the health of your Amazon ECS and Amazon EKS clusters running on AWS Fargate. In this post, we’ll show you how you can: You can use Amazon CloudWatch and related AWS services to gain visibility into your ECS clusters and the Fargate infrastructure that runs them.

AWS Fargate monitoring with Datadog

In Part 1 of this series, we looked at the important metrics to monitor when you’re running ECS or EKS on AWS Fargate. In Part 2 we showed you how to use Amazon CloudWatch and other tools to collect those metrics plus logs from your application containers. Fargate’s serverless container platform helps users deploy and manage ECS and EKS applications, but the dynamic nature of containers makes them challenging to monitor.

Announcing Support for GKE Autopilot

Google Kubernetes Engine (GKE) is the preferred way to run Kubernetes on Google Cloud as it removes the operational overhead of managing the control plane. Earlier today, Google Cloud announced the general availability of GKE Autopilot, which manages your cluster’s entire infrastructure—both the control plane and worker nodes—so that you can spend more time building your applications.

Use Datadog geomaps to visualize your app data by location

Being able to track and aggregate data by region is important when monitoring your application. It can provide visibility into where errors and latency might be occurring, where security threats might be originating, and more. Now, you can use Datadog geomaps to visualize data on a color-coded world map. This helps you understand geographic patterns at a glance, including where users are experiencing outages, app revenue by country, or if a surge in requests is coming from one particular location.

Introducing the Datadog quick nav menu

Datadog’s features give you full visibility into every part of your application environment, so it’s likely you have many resources to switch between as part of your troubleshooting and development workflows. For example, you might switch from the host map to investigate a performance issue with your services in APM, or jump between dashboards to correlate metrics and troubleshoot a problem with your CI/CD pipeline.

Monitor Core Web Vitals with Datadog RUM and Synthetic Monitoring

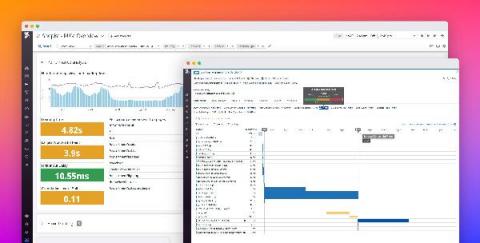
In May 2020, Google introduced Core Web Vitals, a set of three metrics that serve as the gold standard for monitoring a site’s UX performance. These metrics, which focus on load performance, interactivity, and visual stability, simplify UX metric collection by signaling which frontend performance indicators matter the most.

Use associated template variables to refine your dashboards

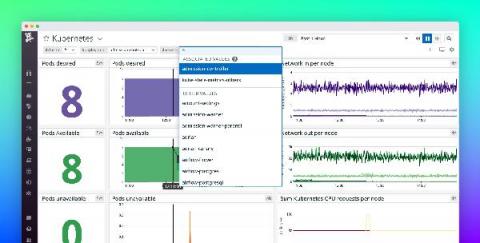
Datadog dashboards provide a foundation for monitoring and troubleshooting your infrastructure and applications, and template variables allow you to focus your dashboards on a particular subset of hosts, containers, or services based on tags or facets. We’re pleased to announce template variable associated values, which can help you speed up your troubleshooting by dynamically presenting the most relevant values for your template variables.