Operations | Monitoring | ITSM | DevOps | Cloud

VLAN monitoring in OpManager

A local area network, what we know more commonly as a LAN, is a network that comprises devices based out of the same geographic location, enabling communication between them. The virtual counterpart of a LAN is a virtual LAN, or VLAN. A VLAN augments a LAN, offering flexibility in making changes, higher scalability, and better security.

Why happy employee experience means happy customer experience

Peanut butter and jelly are two great condiments on their own but pairing them together elevates the sandwich game to a whole other level. That’s pretty much the case with employee experience and customer experience. When organizations pair EX and CX together and channel their efforts to keep both ends of the spectrum happy and delighted, the end result is the sweet and salty aftertaste of PB&J in the form of lower employee turnover and higher customer satisfaction.

Website Testing: 6 Tips to Help You Get it Right

A website's optimization for search engines and SERP ranking is one thing, but its quality assurance is another thing entirely. What's the use of ranking first on search engines but having a website that doesn't function? Website testing monitors if the website performs its functions as intended, assessing if the final output is good enough to present to end-users.

Looking to invest in an asset monitoring solution? Here are 7 niche solutions you should check out.

As businesses grow, the support teams often struggle to keep up with increasing workloads. There is often more than one issue, service request, or customer query that needs resolving, and the staff can be under-equipped to attend to them in real-time. Hence, it is vital to ensure that your IT support staff should be able to maintain high levels of productivity, swiftly address customer demands, and efficiently manage all incoming support requests.

Do More with Less! Use our New GraphQL Query Bot for Cato Networks, Monday.Com, and More

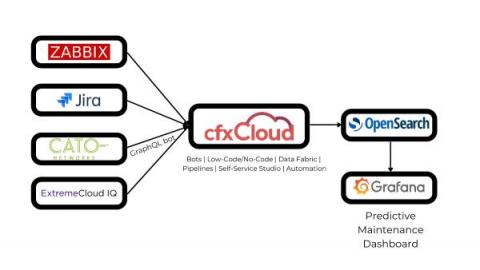
One of our partners in the LATAM region is working with an end customer, to implement a custom predictive maintenance dashboard, by pulling in and correlating data from multiple sources (like Zabbix, Jira Cloud, Cato Networks, Extreme Networks CloudIQ, etc.) and sending out the data to update a Grafana dashboard, which can read data from OpenSearch. Partner is using our data bots and low-code/no-code pipelines to implement this project.