Operations | Monitoring | ITSM | DevOps | Cloud
Latest News
Why an OS Monitoring tool is not sufficient for Monitoring VMware and Other Virtualization Technologies
You have management software that you’ve used for your Linux or Windows servers. Can’t you just deploy a Linux agent and monitor a VMware vSphere/ESX server, or a Windows agent to monitor a Microsoft Hyper-V server? This is a very common question that comes up in any discussion on VMware monitoring and virtualization management. After all, when a VMware ESX server boots, the administrator gets to a Linux login prompt and can login to a Linux operating system.
Minimize business losses by monitoring your applications' performance
Downtime is the biggest nightmare for organizations that capitalize on technology. A study about enterprise outages found that nearly 96 percent of enterprises had faced downtime in the past three years. Businesses lose a minimum of $1.55 million annually and 545 hours of staff time due to IT downtime. Up to 51 percent of downtime is preventable, which means businesses are spending on damage control when these resources could be diverted to something more fruitful, like R&D.
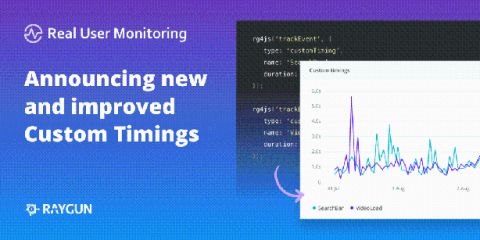
Track any web performance metric with improved custom timings for Real User Monitoring
10 Key Performance Indicators to Consider When Monitoring Server Performance
IT applications are vital for today’s digital economy and for the business to succeed, these applications must be highly available and performing well. Application performance degradations can occur for several reasons. There may be code-level issues, database slowness, or network bandwidth constraints. IT applications run on servers and if the server is not sized correctly or is under-performing, application performance will degrade as well.
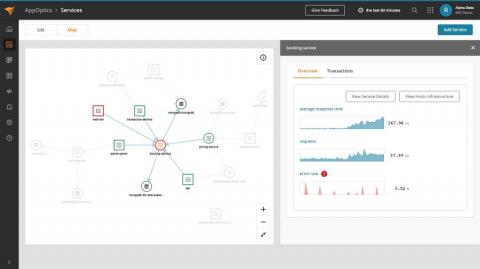
Monitoring Hybrid IT Environments With AppOptics
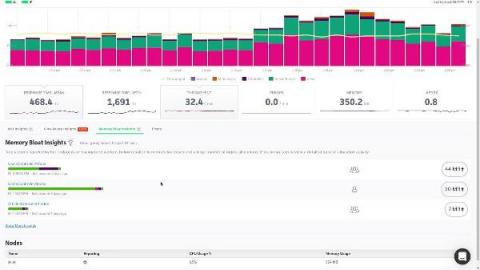
Video: Identifying Memory Bloat
In this video, we are going to take a look at what memory bloat is, and how you can use Scout to eliminate it from your applications. Memory related performance issues have the potential to bring your entire application down, and yet, most APMs completely ignore this fact and fail to provide any useful way of monitoring memory usage at all.
6 Tips for Application Developers to Make Java Applications Faster
Application developers and application operations personnel are together responsible for ensuring that Java web applications perform well. In an earlier blog, we had discussed 7 configurations that Application Operations teams can use to make their Java applications high-performing. In this blog, we will focus on Application Developers and discuss 6 ways in which they can enhance the performance of their Java applications.
A Deep Dive into SignalFx Microservices APM Alerts
The promise of NoSample™ full-fidelity distributed tracing with unlimited cardinality exploration is that no application performance degradation will be sampled away. This ensures that executions, which exemplify problems related to latency and/or errors will be retained for further inspection and analysis. Additional value can be extracted from trace data by determining when such investigations should occur, in other words, by identifying spikes and anomalies in endpoint latency or error rate.


